Master the cTrader Support and Resistance Indicator for Better Entries
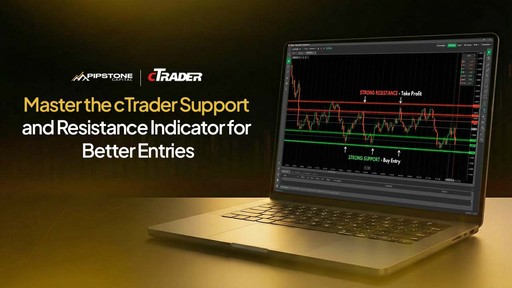
The cTrader support and resistance indicator is one of the most effective tools traders can use to improve entry timing, control risk, and trade with structure instead of emotion. Support and resistance define market behavior, reveal where price reacts, and help traders plan trades with clarity. When applied correctly on cTrader, a well‑used support and resistance indicator can significantly improve entry quality - especially for traders operating under funded or prop‑style rules.
This guide focuses on practical execution, not theory. It’s written for traders who want cleaner entries, controlled risk, and consistency, the mindset required when trading capital in a professional or funded trading environment.
What cTrader Support and Resistance Indicator Actually Represents
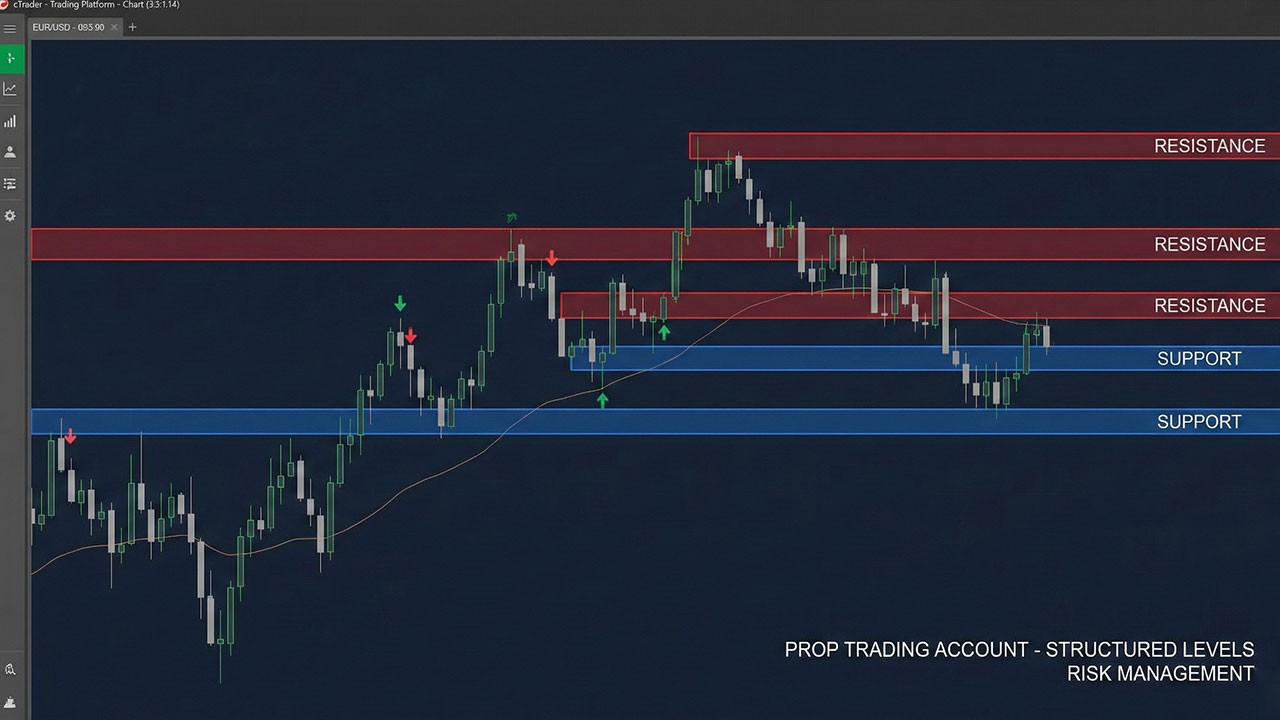
A cTrader support and resistance indicator highlights decision zones created by real market participants.
Support is an area where buying pressure has repeatedly absorbed selling
Resistance is an area where selling pressure has repeatedly capped price advances
These zones exist because:
Institutions and algorithms place orders around key price levels
Liquidity clusters near previous highs and lows
Price revisits areas where strong reactions occurred before
For funded and prop traders, this matters because:
Entries must be planned, not impulsive
Risk must be defined before execution
Drawdown limits must be respected
The cTrader support and resistance indicator helps visualize this structure clearly and consistently.

How cTrader Approaches Support and Resistance
cTrader is well suited for structure-based trading because it prioritizes clean charts and precise tools, which is one of the main reasons many prop traders prefer it over other platforms when comparing cTrader vs MT5 for prop firm trading.
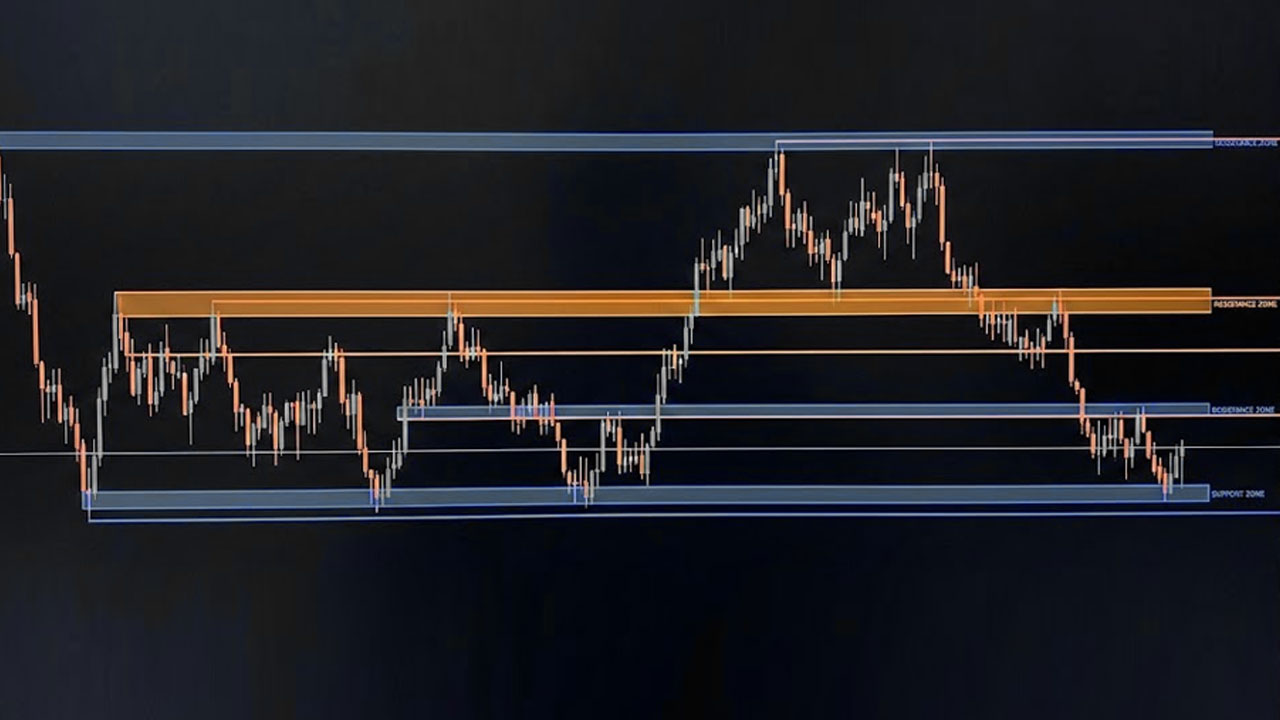
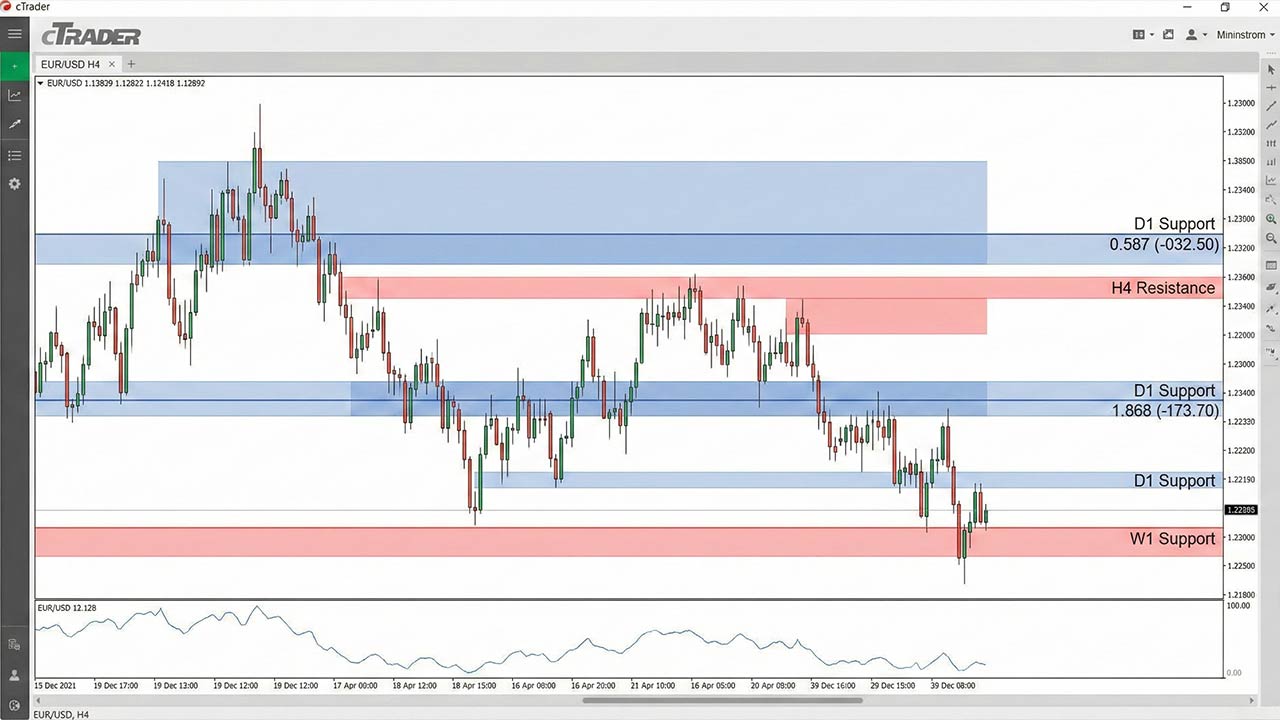
The cTrader support and resistance indicator works by analyzing historical price reactions and plotting zones where price is statistically more likely to react again.
On cTrader, support and resistance can be identified using:
Manual drawing tools
Automatic cTrader support and resistance indicators
Price action combined with confirmation tools
The goal is not to predict price, but to react to it intelligently using the indicator as contextual guidance. Traders who are still getting familiar with the platform often benefit from understanding how to trade on cTrader for prop firm challenges, as platform execution and chart behavior play a direct role in level‑based trading.
Manual Support and Resistance on cTrader (Still the Foundation)
Even with a strong cTrader support and resistance indicator, manual level marking remains essential.
How to Mark High‑Quality Levels Manually
Follow these rules:
Start from H4 or H1 timeframes
Identify areas where price reacted multiple times
Extend levels forward, not backward
Treat levels as zones, not single prices
Manual mapping improves your understanding of what the cTrader support and resistance indicator is showing and prevents blind reliance on automation.
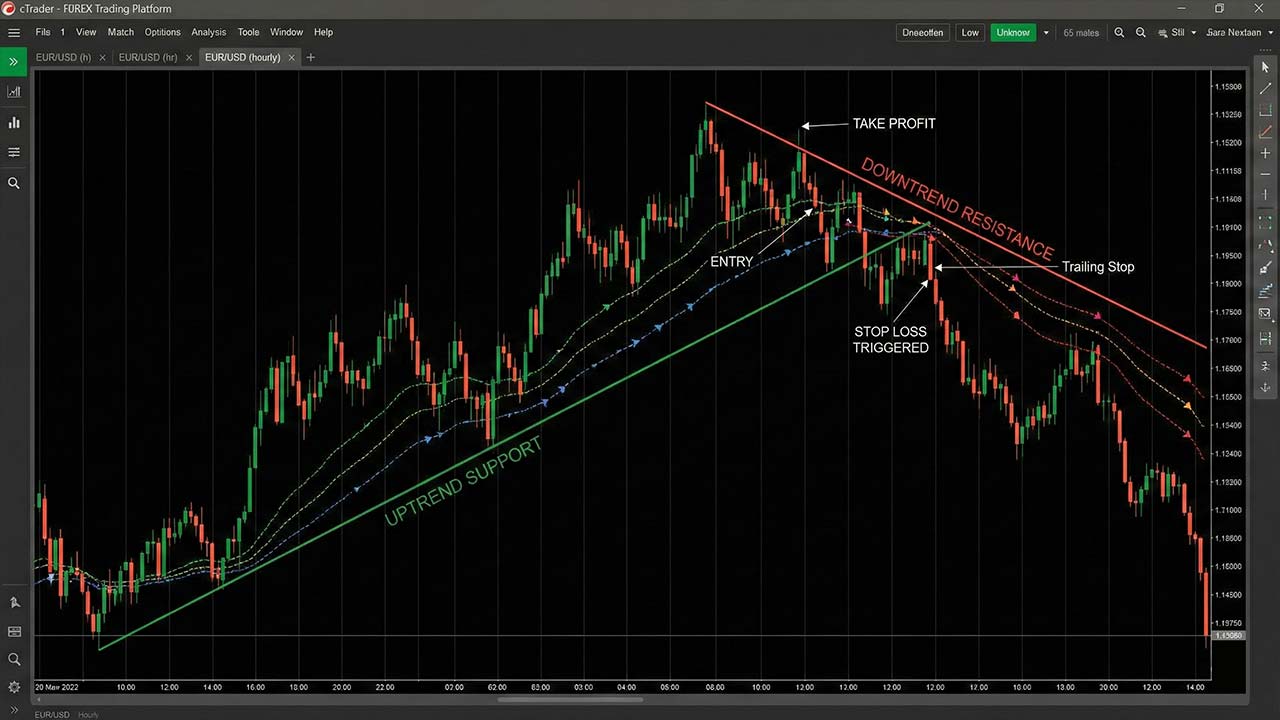
Using Trendlines as Dynamic Support and Resistance
Trendlines act as dynamic support and resistance and complement a cTrader support and resistance indicator when:
The trend is clearly defined
Swing highs or lows are respected
Lines are not forced to fit price
Dynamic levels are useful for trailing stops and managing trades once price moves away from the zone. This becomes especially important during funded evaluations, where execution delays or platform instability can affect trade management around dynamic levels, as explained in cTrader connectivity issues during prop challenges.
Using the cTrader Support and Resistance Indicator Effectively
A cTrader support and resistance indicator should be used as an assistant, not a signal generator.
What a Good cTrader Support and Resistance Indicator Should Do
A quality indicator should:
Plot clear zones, not excessive lines
Adapt to changing market structure
Work consistently across timeframes
Avoid aggressive repainting
The best cTrader support and resistance indicator settings favor clarity over quantity.
How Funded Traders Use the Indicator
Professional traders do not enter trades just because the cTrader support and resistance indicator highlights a level.
Instead:
The indicator defines the zone
Price action confirms the setup
Risk is calculated before execution
This workflow supports discipline and repeatability - both essential in funded and prop trading environments. The same principles are expanded further in the guide on best indicators for cTrader to pass prop firm challenges, where structure‑based tools are favored over signal‑driven strategies.
Best Timeframes for the cTrader Support and Resistance Indicator
Choosing the correct timeframe is more important than the indicator itself.
Higher Timeframes (H4 – Daily)
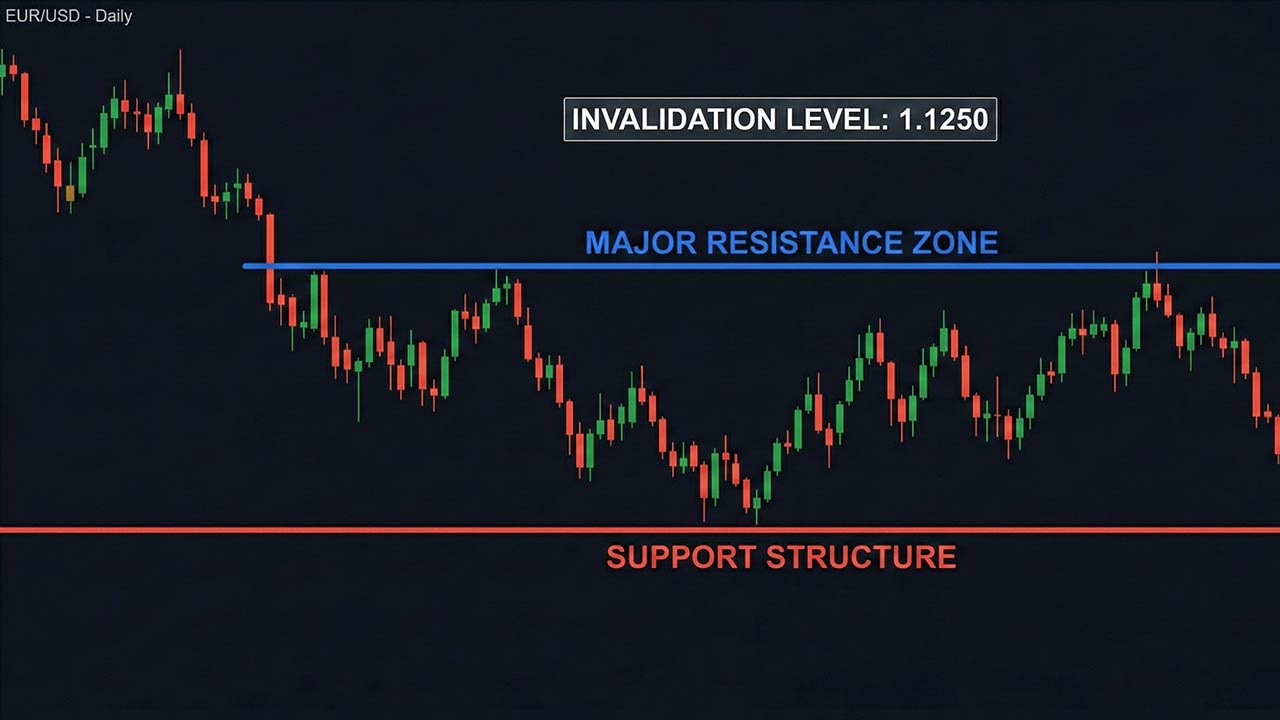
Higher timeframes allow the cTrader support and resistance indicator to:
Define major market structure
Establish directional bias
Identify clear invalidation levels
These timeframes are ideal for traders who want fewer but higher‑quality setups, which is a core requirement when trading under evaluation rules. This aligns closely with our guide on how to pass a prop firm challenge, where trade selectivity is emphasized.
Entry Timeframes (M15 – M30)
Entry timeframes help traders:
Refine entries near indicator zones
Spot rejection or break‑and‑retest behavior
Keep stop‑loss distances controlled
Avoid relying on a cTrader support and resistance indicator on very low timeframes unless you have a tested execution model.
High‑Probability Entry Models Using Support and Resistance Indicator
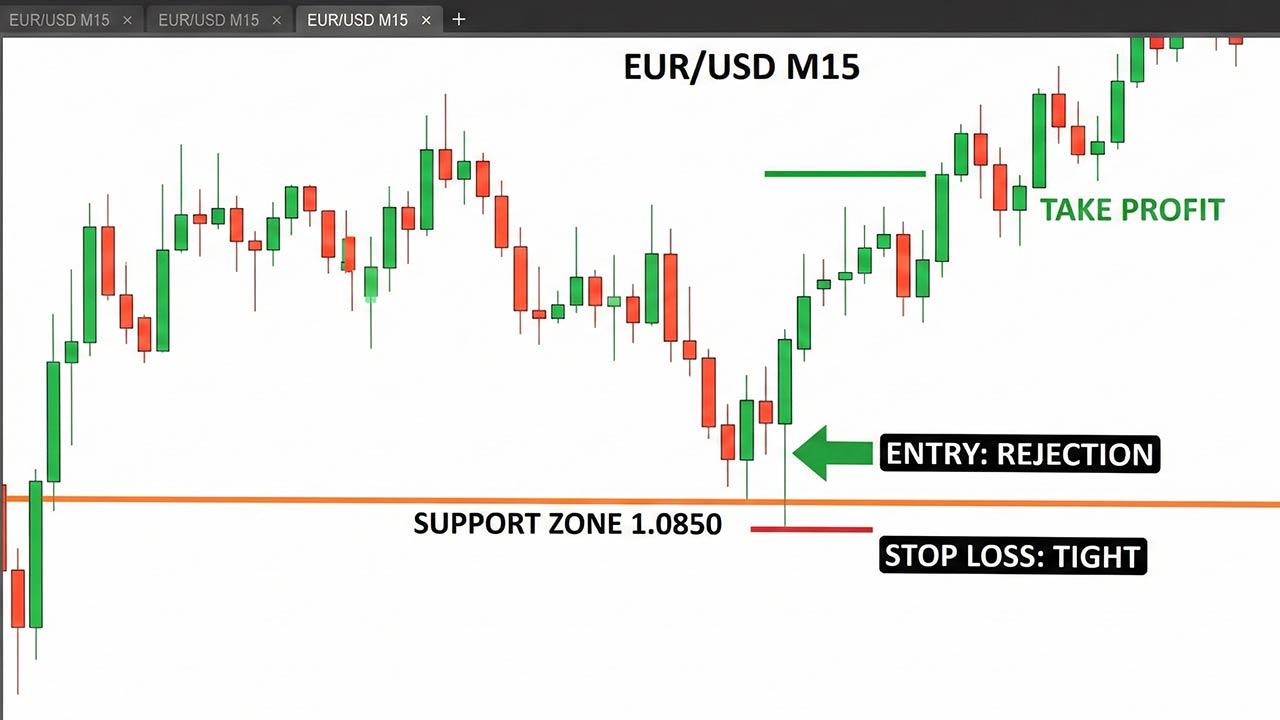
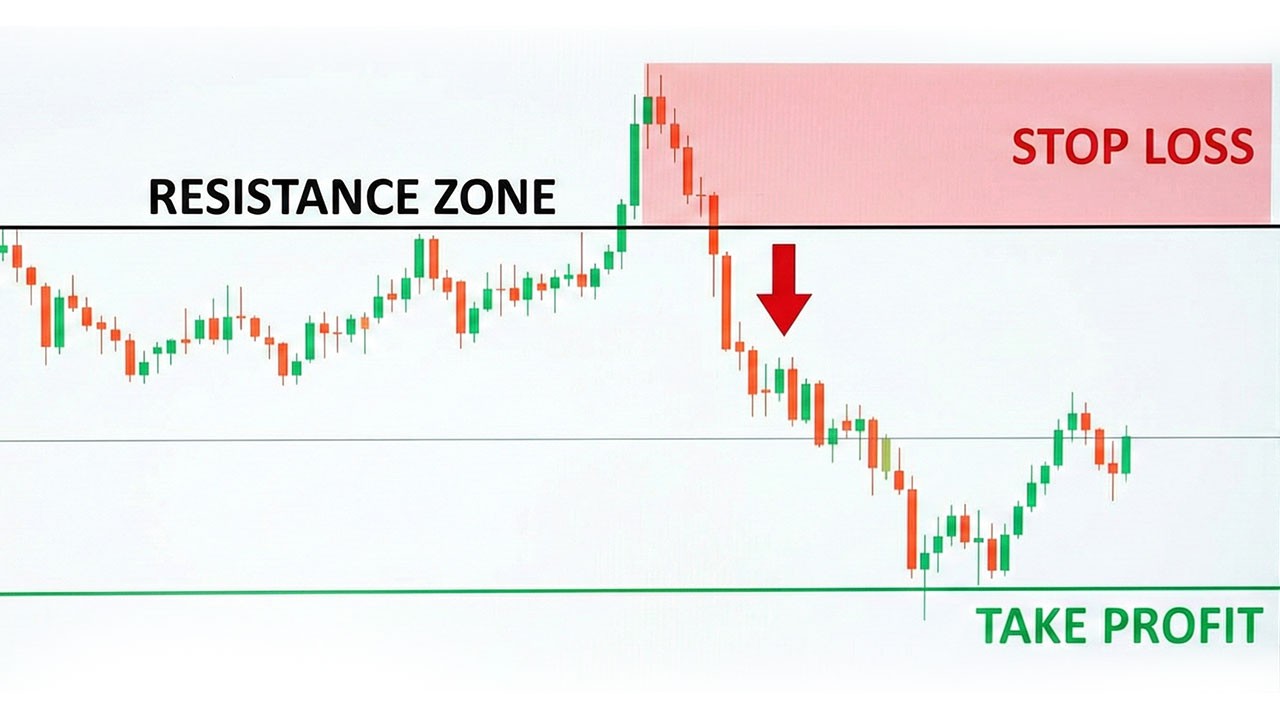
Rejection‑Based Entries
Best for: traders who want tight invalidation and fewer trades.
How it works:
Price reaches a support or resistance zone identified by the indicator
Clear rejection appears
Entry is taken after confirmation
Stop‑loss is placed beyond the zone
This model works well with a cTrader support and resistance indicator because invalidation is clearly defined.
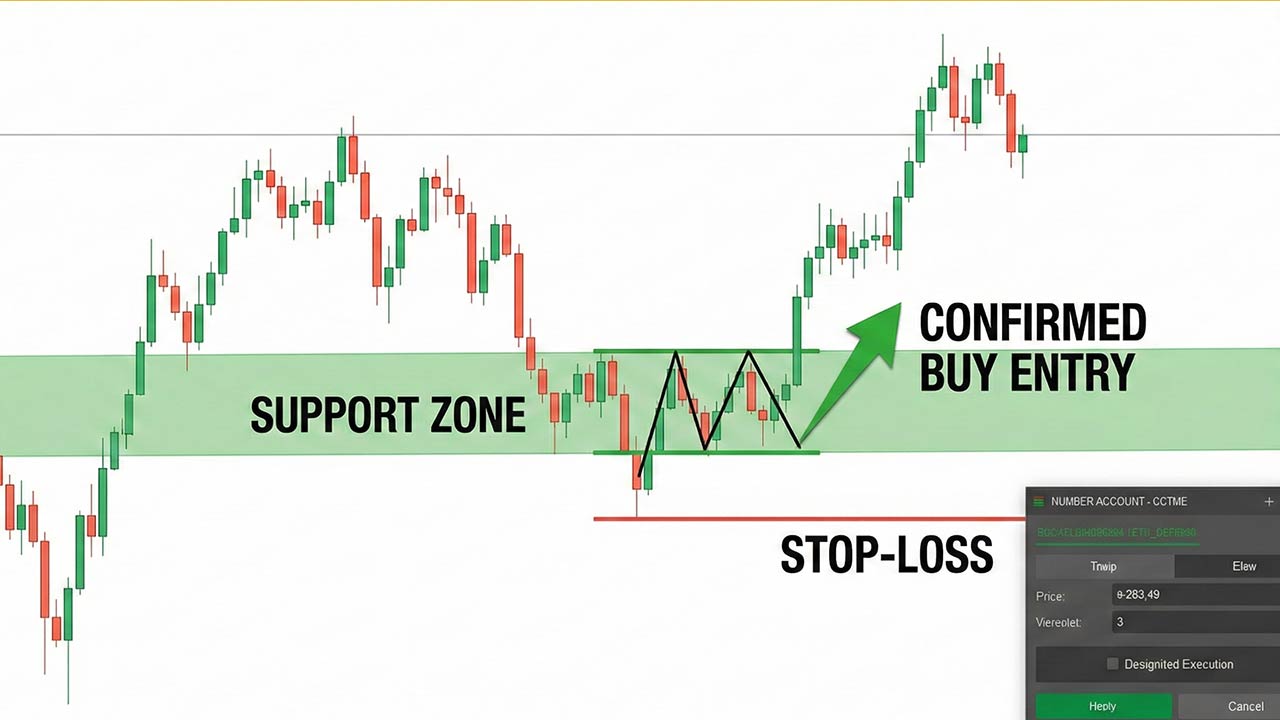
Break and Retest Entries
Best for: structure‑based continuation trades.
How it works:
Price breaks a key indicator level with momentum
Pulls back to retest the zone
Old resistance becomes support (or vice versa)
Entry follows confirmation
This avoids chasing price and improves risk‑to‑reward consistency.
Range‑Based Entries
When markets are sideways, the cTrader support and resistance indicator helps traders:
Buy near support zones
Sell near resistance zones
Define clear targets and stops
Range trading works best during low‑volatility sessions and requires patience.
Common Mistakes When Using a cTrader Support and Resistance Indicator
Many traders fail not because of strategy, but because of execution errors.
Common mistakes include:
Drawing or accepting too many indicator levels
Trading every touch without confirmation
Ignoring higher‑timeframe structure
Moving stop‑losses emotionally
Treating the cTrader support and resistance indicator as a signal
In funded trading, these mistakes are punished quickly, especially within structured prop environments. Traders unfamiliar with these rules should review what prop trading is and how funded trading works, as expectations differ significantly from personal accounts.
Risk Management Around Support and Resistance Indicator
Entries matter, but risk management matters more.
Proper Stop Placement
Stops should be placed beyond the indicator zone, not inside it
If price invalidates the level, the trade idea is wrong
Position Sizing
Risk per trade stays fixed
Lot size adjusts to stop‑loss distance
Risk is never increased to recover losses
This approach mirrors how professional traders manage capital and directly reflects the principles outlined in our article on risk management tools in cTrader, where protecting drawdown is prioritized over aggressive growth.
Combining the cTrader Support and Resistance Indicator With Confirmation Tools
The cTrader support and resistance indicator works best when paired with light confirmation.
Effective confirmations include:
RSI divergence at indicator zones
EMA confluence
Previous day high or low
Session highs and lows
Two confirmations are enough. More often leads to hesitation and missed trades.
Final Thoughts: Trade Levels, Not Feelings
Mastering the cTrader support and resistance indicator is not about finding a perfect setting. It’s about understanding how price behaves around real decision zones and executing with discipline.
When you combine:
Clean higher‑timeframe mapping
A reliable cTrader support and resistance indicator
A defined entry model
Logical invalidation and stop placement
Proper position sizing
You naturally improve entry quality without increasing trade frequency.
This is also the execution mindset expected in a prop‑firm environment like Pipstone Capital, where traders are evaluated on discipline and controlled risk rather than trade volume. Using the cTrader support and resistance indicator to define clear levels, tight invalidation, and measured position sizing aligns directly with how professional prop traders are expected to operate.
Trade the level. Respect invalidation. Manage risk.
That is how consistency is built using the cTrader support and resistance indicator.
FAQ: cTrader Support and Resistance Indicator
Is a cTrader support and resistance indicator enough on its own?
No. A cTrader support and resistance indicator provides structure, but entries should always be confirmed with price action and risk management rules.
Which timeframe works best with a cTrader support and resistance indicator?
Higher timeframes such as H1, H4, and Daily provide the most reliable zones. Lower timeframes are best used only for execution.
Do funded traders rely on a cTrader support and resistance indicator?
Yes, but only as context. Funded traders use the indicator to identify zones, then apply strict entry models and risk controls.


Master the cTrader Support and Resistance Indicator for Better Entries
The cTrader support and resistance indicator is one of the most effective tools traders can use to improve entry timing, control risk, and trade with structure instead of emotion. Support and resistance define market behavior, reveal where price reacts, and help traders plan trades with clarity. When applied correctly on cTrader, a well‑used support and resistance indicator can significantly improve entry quality - especially for traders operating under funded or prop‑style rules.
This guide focuses on practical execution, not theory. It’s written for traders who want cleaner entries, controlled risk, and consistency, the mindset required when trading capital in a professional or funded trading environment.
What cTrader Support and Resistance Indicator Actually Represents
A cTrader support and resistance indicator highlights decision zones created by real market participants.
Support is an area where buying pressure has repeatedly absorbed selling
Resistance is an area where selling pressure has repeatedly capped price advances
These zones exist because:
Institutions and algorithms place orders around key price levels
Liquidity clusters near previous highs and lows
Price revisits areas where strong reactions occurred before
For funded and prop traders, this matters because:
Entries must be planned, not impulsive
Risk must be defined before execution
Drawdown limits must be respected
The cTrader support and resistance indicator helps visualize this structure clearly and consistently.
How cTrader Approaches Support and Resistance
cTrader is well suited for structure-based trading because it prioritizes clean charts and precise tools, which is one of the main reasons many prop traders prefer it over other platforms when comparing cTrader vs MT5 for prop firm trading.
The cTrader support and resistance indicator works by analyzing historical price reactions and plotting zones where price is statistically more likely to react again.
On cTrader, support and resistance can be identified using:
Manual drawing tools
Automatic cTrader support and resistance indicators
Price action combined with confirmation tools
The goal is not to predict price, but to react to it intelligently using the indicator as contextual guidance. Traders who are still getting familiar with the platform often benefit from understanding how to trade on cTrader for prop firm challenges, as platform execution and chart behavior play a direct role in level‑based trading.
Manual Support and Resistance on cTrader (Still the Foundation)
Even with a strong cTrader support and resistance indicator, manual level marking remains essential.
How to Mark High‑Quality Levels Manually
Follow these rules:
Start from H4 or H1 timeframes
Identify areas where price reacted multiple times
Extend levels forward, not backward
Treat levels as zones, not single prices
Manual mapping improves your understanding of what the cTrader support and resistance indicator is showing and prevents blind reliance on automation.
Using Trendlines as Dynamic Support and Resistance
Trendlines act as dynamic support and resistance and complement a cTrader support and resistance indicator when:
The trend is clearly defined
Swing highs or lows are respected
Lines are not forced to fit price
Dynamic levels are useful for trailing stops and managing trades once price moves away from the zone. This becomes especially important during funded evaluations, where execution delays or platform instability can affect trade management around dynamic levels, as explained in cTrader connectivity issues during prop challenges.
Using the cTrader Support and Resistance Indicator Effectively
A cTrader support and resistance indicator should be used as an assistant, not a signal generator.
What a Good cTrader Support and Resistance Indicator Should Do
A quality indicator should:
Plot clear zones, not excessive lines
Adapt to changing market structure
Work consistently across timeframes
Avoid aggressive repainting
The best cTrader support and resistance indicator settings favor clarity over quantity.
How Funded Traders Use the Indicator
Professional traders do not enter trades just because the cTrader support and resistance indicator highlights a level.
Instead:
The indicator defines the zone
Price action confirms the setup
Risk is calculated before execution
This workflow supports discipline and repeatability - both essential in funded and prop trading environments. The same principles are expanded further in the guide on best indicators for cTrader to pass prop firm challenges, where structure‑based tools are favored over signal‑driven strategies.
Best Timeframes for the cTrader Support and Resistance Indicator
Choosing the correct timeframe is more important than the indicator itself.
Higher Timeframes (H4 – Daily)
Higher timeframes allow the cTrader support and resistance indicator to:
Define major market structure
Establish directional bias
Identify clear invalidation levels
These timeframes are ideal for traders who want fewer but higher‑quality setups, which is a core requirement when trading under evaluation rules. This aligns closely with our guide on how to pass a prop firm challenge, where trade selectivity is emphasized.
Entry Timeframes (M15 – M30)
Entry timeframes help traders:
Refine entries near indicator zones
Spot rejection or break‑and‑retest behavior
Keep stop‑loss distances controlled
Avoid relying on a cTrader support and resistance indicator on very low timeframes unless you have a tested execution model.
High‑Probability Entry Models Using Support and Resistance Indicator
Rejection‑Based Entries
Best for: traders who want tight invalidation and fewer trades.
How it works:
Price reaches a support or resistance zone identified by the indicator
Clear rejection appears
Entry is taken after confirmation
Stop‑loss is placed beyond the zone
This model works well with a cTrader support and resistance indicator because invalidation is clearly defined.
Break and Retest Entries
Best for: structure‑based continuation trades.
How it works:
Price breaks a key indicator level with momentum
Pulls back to retest the zone
Old resistance becomes support (or vice versa)
Entry follows confirmation
This avoids chasing price and improves risk‑to‑reward consistency.
Range‑Based Entries
When markets are sideways, the cTrader support and resistance indicator helps traders:
Buy near support zones
Sell near resistance zones
Define clear targets and stops
Range trading works best during low‑volatility sessions and requires patience.
Common Mistakes When Using a cTrader Support and Resistance Indicator
Many traders fail not because of strategy, but because of execution errors.
Common mistakes include:
Drawing or accepting too many indicator levels
Trading every touch without confirmation
Ignoring higher‑timeframe structure
Moving stop‑losses emotionally
Treating the cTrader support and resistance indicator as a signal
In funded trading, these mistakes are punished quickly, especially within structured prop environments. Traders unfamiliar with these rules should review what prop trading is and how funded trading works, as expectations differ significantly from personal accounts.
Risk Management Around Support and Resistance Indicator
Entries matter, but risk management matters more.
Proper Stop Placement
Stops should be placed beyond the indicator zone, not inside it
If price invalidates the level, the trade idea is wrong
Position Sizing
Risk per trade stays fixed
Lot size adjusts to stop‑loss distance
Risk is never increased to recover losses
This approach mirrors how professional traders manage capital and directly reflects the principles outlined in our article on risk management tools in cTrader, where protecting drawdown is prioritized over aggressive growth.
Combining the cTrader Support and Resistance Indicator With Confirmation Tools
The cTrader support and resistance indicator works best when paired with light confirmation.
Effective confirmations include:
RSI divergence at indicator zones
EMA confluence
Previous day high or low
Session highs and lows
Two confirmations are enough. More often leads to hesitation and missed trades.
Final Thoughts: Trade Levels, Not Feelings
Mastering the cTrader support and resistance indicator is not about finding a perfect setting. It’s about understanding how price behaves around real decision zones and executing with discipline.
When you combine:
Clean higher‑timeframe mapping
A reliable cTrader support and resistance indicator
A defined entry model
Logical invalidation and stop placement
Proper position sizing
You naturally improve entry quality without increasing trade frequency.
This is also the execution mindset expected in a prop‑firm environment like Pipstone Capital, where traders are evaluated on discipline and controlled risk rather than trade volume. Using the cTrader support and resistance indicator to define clear levels, tight invalidation, and measured position sizing aligns directly with how professional prop traders are expected to operate.
Trade the level. Respect invalidation. Manage risk.
That is how consistency is built using the cTrader support and resistance indicator.
FAQ: cTrader Support and Resistance Indicator
Is a cTrader support and resistance indicator enough on its own?
No. A cTrader support and resistance indicator provides structure, but entries should always be confirmed with price action and risk management rules.
Which timeframe works best with a cTrader support and resistance indicator?
Higher timeframes such as H1, H4, and Daily provide the most reliable zones. Lower timeframes are best used only for execution.
Do funded traders rely on a cTrader support and resistance indicator?
Yes, but only as context. Funded traders use the indicator to identify zones, then apply strict entry models and risk controls.
