


XAU/USD Technical Analysis: How to Read Gold Charts

Gold can move $20 or $30 in a short session. Sometimes the move starts at a clear price level. Other times, it breaks that level and turns straight back.
That's why learning how to read gold charts matters.
XAU/USD technical analysis helps traders understand where gold might move next based on past price movements. By studying candlesticks, trends, support and resistance, and market structure, you can find potential entries and exits instead of guessing.
For example, imagine gold has been climbing for several days. It reaches $2,450, pulls back to $2,420, and starts moving higher again. Is this a good buying opportunity, or could gold fall further?
The answer depends on what the chart shows. You need to check whether $2,420 is a strong support zone, whether buyers are defending it, and whether the larger trend still points upward.
The same applies when gold breaks resistance. A move above a key level might start a new rally, but it could also be a false breakout that traps buyers.
This is where price action and market structure become useful. They help you understand what buyers and sellers are doing, rather than relying on a single candle or indicator.
You don't need ten indicators to read XAU/USD charts. You need to know which price levels matter, how trends develop, and when a trading setup is no longer valid.
In this guide, we'll break down gold technical analysis step by step. You'll learn how to spot trends, draw support and resistance, identify breakouts, and use multiple timeframes. We'll also work through chart examples with entry prices, stop losses, profit targets, and risk-to-reward ratios.
All price levels below are illustrative examples, not live gold prices.
1. How to Read Gold Charts Using Candlesticks
Candlestick charts show how gold prices move within a chosen timeframe. Each candle represents a set period, whether that's five minutes, one hour, or one day.
Every candlestick shows four prices:
Open: Where gold started trading during that period.
High: The highest price reached.
Low: The lowest price reached.
Close: Where the candle finished.
A green candle means gold closed above its opening price. A red candle means it closed below.
But the candle's shape tells you more.
A long candle body often shows strong movement in one direction. A small body suggests buyers and sellers finished close to where they started.
Long wicks reveal something else. They show prices that gold reached but couldn't hold.
For example, a long upper wick near resistance suggests buyers pushed gold higher but failed to keep it there.
A long lower wick near support suggests sellers pushed gold down before buyers drove it back up.
The location of these candles matters more than their shape alone.
Technical analysis works best when it forms part of a gold trading strategy with clear risk and entry rules.

Chart Example 1: A Bullish Rejection Candle
Imagine gold approaches support at $2,400 on the 1-hour chart.
The candle shows:
Price | XAU/USD |
Open | $2,410 |
High | $2,430 |
Low | $2,392 |
Close | $2,426 |
Gold briefly fell below $2,400 but recovered and closed near its high.
That long lower wick shows buyers pushed back against the selloff.
Does this mean you should buy?
Not yet.
A bullish rejection candle warns that sellers may be losing control. It isn't proof that gold will rise.
You need to understand why the rejection happened and what price does next.
Step 1: Check Whether $2,400 Is an Important Support Level
Look at the previous candles on your H1 and H4 charts.
Suppose gold bounced from $2,400 twice during the past three trading sessions. Each time, buyers stepped in and pushed price higher.
That tells you traders are paying attention to this area.
Instead of drawing one line at $2,400, mark a support zone between $2,395 and $2,405.
Gold doesn't always reverse at an exact price. It might briefly break below support before moving back above it.
That's what happened when the candle touched $2,392 and recovered.
However, repeated tests don't guarantee support will hold. If each bounce becomes weaker, sellers may eventually break through.
Step 2: Wait for the Next Candle to Confirm the Rejection
The rejection candle closed at $2,426, just below its $2,430 high.
Now watch the next H1 candle.
Imagine it opens near $2,426, briefly pulls back, then climbs above $2,430 and closes at $2,435.
This gives you two useful signals.
First, buyers defended the $2,400 support zone. Second, they pushed gold above the rejection candle's high.
That's stronger evidence than the first candle alone.
But what if the next candle falls instead?
Suppose gold drops back to $2,400 and closes at $2,396. The rejection has failed to produce an upward move.
Buying immediately after the first green candle would have been premature.
Step 3: Find an Entry Without Chasing Price
A candle closing above $2,430 doesn't mean you must buy at once.
Check the distance to the next resistance level and your planned stop.
For example, if gold breaks above $2,430 and pulls back toward $2,425, watch whether buyers defend that area.
A higher low on M15, followed by another move upward, may provide a clearer entry.
Suppose that pullback forms a confirmed swing low at $2,418. A trader could consider an entry around $2,432, with a stop below that swing low.
The key is that the stop must sit beyond a meaningful chart level, not at a random price.
Step 4: Know When Your Analysis Is Wrong
A move below $2,392 would break the rejection candle's low.
That weakens the original bullish signal.
A tighter stop below a confirmed M15 swing low might make sense for a short-term trade. But it could be hit even while the larger H1 support zone survives.
Your stop depends on which setup you're trading.
The lesson: Don't trade a candlestick just because it has a long wick. Check its location, the next candle's reaction, and the larger trend.
2. Identify Trends Through XAU/USD Market Structure
Before drawing indicators or looking for entries, check the overall trend.
Gold moves through a series of swing highs and swing lows. These turning points help you understand whether buyers or sellers control the market.
A swing high forms when gold rises, stops, and starts pulling back. A swing low forms when price falls, finds buyers, and moves upward.
The relationship between these points reveals the market structure. Traders can then use an XAU/USD price action strategy to judge how price behaves around those levels.
For example, gold might climb from $2,400 to $2,450, pull back to $2,425, and rise again to $2,480.
The second rally reached a higher price than the first. The pullback also stopped above the previous low.
That tells you buyers are willing to enter at higher prices.
But if gold later breaks below $2,425, the short-term structure has changed.
This doesn't always mean a full downtrend has started. Gold could simply be entering a deeper pullback.
You need to watch the next swing high and low before deciding.

Bullish Market Structure: Higher Highs and Higher Lows
An uptrend forms when gold keeps making higher highs (HH) and higher lows (HL).
Chart Example 2: Reading a Gold Uptrend
Imagine the daily XAU/USD chart shows this sequence:
Price movement | Market structure |
$2,360 → $2,425 | First swing high |
$2,425 → $2,390 | Higher low |
$2,390 → $2,470 | Higher high |
$2,470 → $2,440 | New higher low |
Buyers remain in control while gold holds its main swing lows.
Instead of buying at $2,470 after a strong rally, you could wait for a pullback toward $2,440.
That gives you a clearer entry and a closer point for your stop loss.
If gold breaks below $2,440, the latest higher low has failed. A deeper move below $2,390 would weaken the broader bullish structure further.
Bearish Market Structure: Lower Highs and Lower Lows
A downtrend is the opposite.
Gold makes lower highs and lower lows. Each rally fails below the previous high, and sellers push price lower.
Imagine gold falls from $2,480 to $2,420, then rebounds to $2,450.
It fails to reach the previous $2,480 high and drops to $2,390.
This creates a lower high followed by a lower low.
Instead of buying every dip, a trader might watch for a rally toward 2,440–2,450.
If sellers return near that area, it could offer a short setup with the downtrend.
How to Spot a Possible Trend Reversal
A break in market structure can warn that a trend is losing strength.
Suppose gold is making lower highs at $2,460 and $2,440.
It then breaks above $2,440, forms a higher low, and climbs past $2,460.
The earlier bearish pattern has changed.
Still, one break isn't enough to confirm a lasting reversal. Check whether gold can hold the new support and keep making higher lows.
This is one of the most useful parts of XAU/USD technical analysis. You're reading how price behaves rather than trying to predict every move.
3. Find Support and Resistance on Gold Charts

Support and resistance are among the most useful tools in gold technical analysis.
Support is an area where buyers have previously stepped in.
Resistance is an area where sellers have previously stopped a rally.
Treat them as price zones, not exact lines.
When drawing these zones, look for areas where gold has reversed several times.
Start with the daily chart. Mark the clearest swing highs and lows, then move to H4 for a closer look.
Avoid filling your chart with dozens of horizontal lines. Focus on the levels that price has reacted to most clearly.
Traders can use a XAU/USD support and resistance strategy to identify areas where XAU/USD has reacted several times.
Chart Example 3: Support Turning Into Resistance
Suppose gold has repeatedly bounced between $2,398 and $2,405.
You mark that area as support.
Gold then breaks below $2,398 and closes at $2,385.
Later, price rallies back toward $2,400 but fails to move higher.
The old support has become resistance.
A trader might watch for a bearish candle near $2,400 before considering a short trade.
However, if gold closes back above $2,405 and holds there, the bearish setup loses strength.
How to Tell Whether a Gold Price Level Is Strong
Look at three things.
First, check how price reacted there before. Sharp moves away from a zone show that it mattered at the time.
Second, check the timeframe. A major daily support zone generally deserves more attention than a minor level on M5.
Third, look at how gold approaches it.
A slow pullback with smaller candles differs from a sharp selloff with several large bearish candles.
If gold drops straight into support with strong selling, don't assume buyers will stop it.
Wait to see how price reacts.
Practical tip: Mark support and resistance on D1 and H4 first. Then use H1 or M15 to study the candles forming around those areas.
4. Use Multiple Timeframes for Gold Technical Analysis
One chart rarely tells the full story.
A 15-minute chart might show a downtrend while the daily chart remains bullish.
Both can be correct.
The daily chart might be showing a major uptrend, while M15 captures a short pullback inside it.
This is why traders use multiple timeframe analysis.
Timeframe | What to look for |
Daily (D1) | Main trend and major price levels |
4-hour (H4) | Pullbacks, swing highs, and support zones |
15-minute (M15) | Entry signals and stop-loss placement |
Chart Example 4: A Multi-Timeframe Gold Buy Setup
Gold is bullish on the daily chart.
On H4, price pulls back from $2,490 toward support between $2,450 and $2,456.
Switch to M15.
Gold briefly falls to $2,447, climbs back above support, and closes at $2,460.
You now have three pieces of information.
The daily trend favors buyers. The H4 chart shows a pullback into support. The M15 chart shows buyers returning.
This is stronger than buying simply because one green candle appeared.
What If the Timeframes Disagree?
Suppose D1 remains bullish, but H4 keeps making lower highs.
That suggests gold is still correcting.
You could wait for H4 to stop making lower lows before looking for long trades.
There's no need to force an entry when the charts disagree.
The goal isn't to make every timeframe look bullish or bearish. It's to understand which trend you're trading and where your entry fits inside it.
5. Four Practical XAU/USD Technical Analysis Trading Setups
Reading gold charts becomes more useful when you can turn your analysis into a trading plan.
The following examples show four setups traders commonly watch.
Each includes an entry, stop loss, target, and risk-to-reward ratio.
Setup 1: Trading a Gold Pullback in an Uptrend
Use the bullish scenario from our earlier example.
Gold has recovered from its pullback and closed above $2,460.
Example trade plan:
Trade details | Price |
Entry | $2,461 |
Stop loss | $2,444 |
First resistance | $2,490 |
Final target | $2,495 |
Risk | $17 per ounce |
Potential reward | $34 per ounce |
Risk-to-reward ratio | 1:2 |
Why does this setup make sense?
You're trading with the larger trend, not against it.
Your stop sits below the recent pullback low. If price falls through that area, the bullish idea is weakened.
The previous high at $2,490 is your first obstacle.
If gold struggles there, you may choose to take profit rather than wait for $2,495.
Don't force the trade if the entry rises too far from support.
Setup 2: Trading a Gold Breakout and Retest
A breakout happens when gold moves beyond an established price level.
But not every breakout lasts.
Imagine gold has tested resistance between $2,470 and $2,478 three times.
On the H1 chart, price finally closes at $2,486.
Instead of chasing that candle, wait.
Gold pulls back to $2,474, then rebounds and closes above $2,482.
The old resistance is now acting as support.

Example trade plan:
Trade details | Price |
Entry | $2,482 |
Stop loss | $2,463 |
Target | $2,520 |
Risk | $19 |
Potential reward | $38 |
Risk-to-reward ratio | 1:2 |
The retest helps show whether buyers can defend the breakout.
If gold closes back below the former resistance zone and fails to recover, avoid forcing a long trade.
Also check the space above your entry. Nearby resistance could limit the move.
Setup 3: Spotting a False Breakout on XAU/USD
False breakouts are common on gold charts.
Price moves beyond a level, attracts traders, then reverses.
Imagine resistance sits near $2,465.
Gold spikes to $2,478 but closes back at $2,458.
That's your first warning.
On M15, price then forms a lower high at $2,464 and breaks below $2,455.
Sellers may be taking control.
Example trade plan:
Trade details | Price |
Entry | $2,453 |
Stop loss | $2,469 |
Target | $2,421 |
Risk | $16 |
Potential reward | $32 |
Risk-to-reward ratio | 1:2 |
The stop sits above the new lower high. A move back above it weakens the short-term bearish setup.
Notice that you didn't sell the first spike.
You waited for price to reject resistance, form a lower high, and break short-term support.
That extra confirmation can help avoid entering too early.
Setup 4: Trading Gold in a Sideways Range
Gold doesn't always trend.
Sometimes it moves between support and resistance for hours or days.
Imagine H1 shows a range between $2,390 and $2,430.
Gold tests $2,390 several times but cannot hold below it.
On M15, price briefly falls to $2,389, recovers, and closes at $2,396.
Example trade plan:
Trade details | Price |
Entry | $2,396 |
Stop loss | $2,385 |
Target | $2,422 |
Risk | $11 |
Potential reward | $26 |
Risk-to-reward ratio | Approximately 1:2.4 |
The plan is to buy near the range floor and take profit before resistance.
But if gold starts closing below $2,390, the range may be breaking down.
Don't keep buying just because support worked yesterday.
6. Best Indicators to Support XAU/USD Chart Analysis
Indicators can help you read a gold chart. They shouldn't make every trading decision.
Three tools are worth learning.
20 EMA and 50 EMA: Reading Gold Trends
Moving averages help show trend direction.
When the 20 EMA is above the 50 EMA and both slope upward, short-term momentum supports buyers.
Watch how gold behaves when it pulls back toward them.
For example, gold could fall from $2,480 to the rising 20 EMA near $2,450.
If that area also matches H4 support, the level deserves attention.
But a moving-average touch alone isn't an entry signal.
Wait for price to respond.
If gold breaks below both averages and starts forming lower highs, the earlier trend may be weakening.
RSI: Spotting Momentum Changes
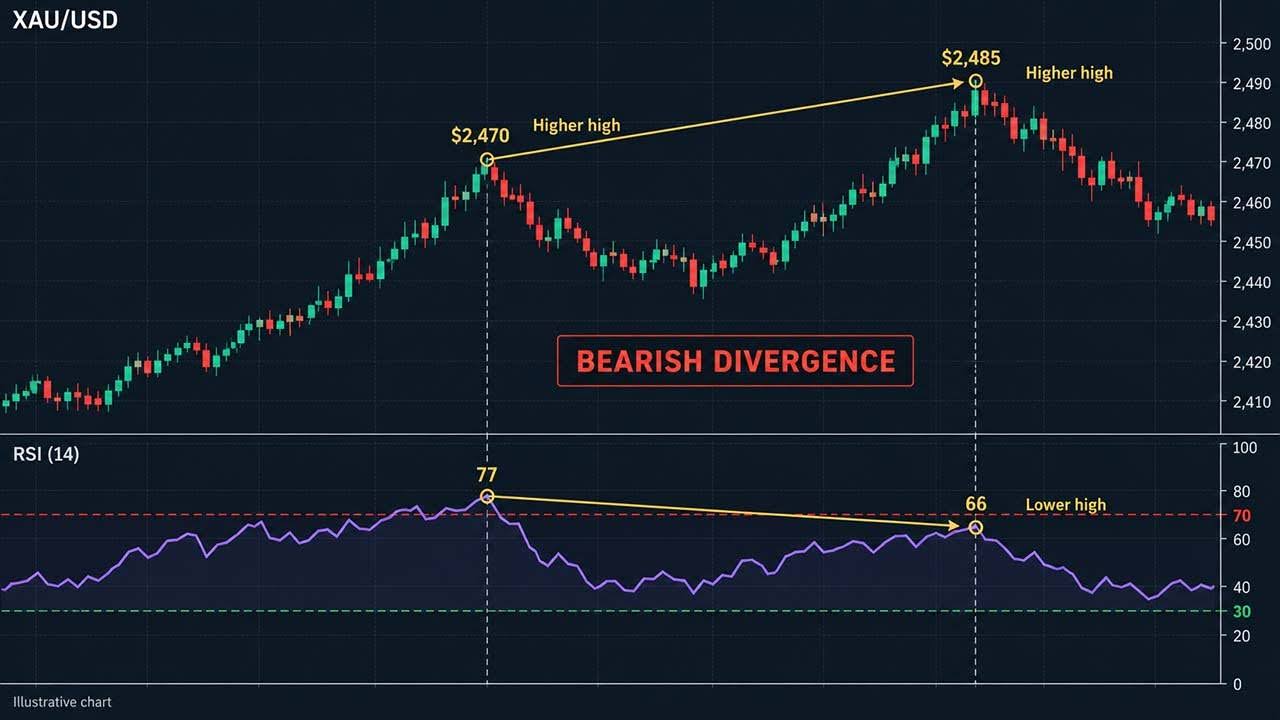
The Relative Strength Index (RSI) measures momentum from 0 to 100.
Readings above 70 are often called overbought. Below 30 is considered oversold.
Neither guarantees a reversal.
Gold can remain above 70 during a strong rally. Selling every time RSI reaches that level can put you against the trend.
A better way to use RSI is to compare its movement with price.
Chart Example 5: Bearish RSI Divergence
Gold makes a high at $2,470 while RSI reaches 77.
Later, gold rises to $2,485, but RSI peaks at only 66.
Price made a higher high. RSI made a lower high.
This is bearish divergence.
It suggests the rally has lost some strength.
However, gold can keep rising despite divergence. Look for a break below a recent swing low before treating it as stronger bearish evidence.
ATR: Measuring Gold Price Volatility
Average True Range (ATR) measures how much price typically moves per candle.
Suppose H1 ATR reads $12.
A $3 stop may be too tight for the current market conditions.
Gold could move against you by $3 during an ordinary pullback before continuing in your expected direction.
ATR doesn't tell you which way to trade. It helps you judge whether your stop has enough room.
Use nearby market structure to choose the stop, then check whether that distance fits your risk limit. Indicators can add extra context to a chart, but the best indicator for XAUUSD trading depends on what the trader wants to measure.
7. How to Read Gold Chart Patterns
Gold traders often watch double tops, double bottoms, triangles, and flags.
These patterns can help you spot possible breakouts and reversals.
But avoid trading a pattern before it has formed.
Double Top: A Possible Bearish Reversal
Imagine gold reaches $2,460, drops to $2,430, then rallies back toward $2,460.
The second rally fails.
This forms two highs near the same price.
However, two peaks alone don't confirm a reversal.
The key level is the neckline near $2,430.
If gold closes below it and fails to recover, the bearish pattern has stronger confirmation.
A measured target would be around $2,400, based on the roughly $30 height of the pattern.
Treat that target as an estimate, not a promise.
Double Bottom: A Possible Bullish Reversal
Now imagine gold falls to $2,390, rebounds to $2,420, and drops back toward $2,390.
Buyers defend that support zone again.
If price later breaks above $2,420, the pattern gains strength.
A measured target could be around $2,450, though nearby resistance may stop the move sooner.
The key is to wait for price to break the neckline rather than buying simply because two lows look similar.
Gold Flags and Triangle Breakouts
A bullish flag can form after a strong rally.
Gold rises sharply, then moves sideways or pulls back in a narrow channel.
If price breaks above that channel, the earlier rally may continue.
Triangles work in a similar way. Price swings become smaller as gold moves toward a narrower range.
When gold finally breaks out, watch the candle close and any retest.
A breakout without follow-through can quickly turn into a losing trade.
Chart patterns work best when they match the larger trend and form near meaningful price levels.
8. Manage Risk Before Placing a Gold Trade
Even a strong XAU/USD technical analysis setup can fail.
Risk management keeps one losing trade from doing too much damage.
Suppose your trading account has $5,000, and you risk 1% per trade.
Your maximum planned loss is $50.
You want to buy gold at $2,461, with a stop at $2,446.
That's $15 risk per ounce.
Assuming a standard XAU/USD contract of 100 ounces per lot, a 0.03-lot position equals three ounces.
A $15 move against three ounces means a $45 loss before fees and slippage.
Always check your broker's contract size, spread, and execution rules. They can differ.
Calculate Risk Before Choosing Your Lot Size
A common mistake is choosing a position size first, then placing a stop wherever it fits.
Do the opposite.
Find the price that would prove your setup wrong. Measure the distance from your entry. Then choose a lot size that keeps your planned loss within your limit.
If the correct stop is too far away for your account size, reduce the position or skip the trade.
Never move your stop farther away simply because gold is approaching it.
9. Be Careful Around Major Economic News
Gold can react sharply to US inflation reports, jobs data, and Federal Reserve decisions.
A strong candle during news doesn't always signal a lasting trend.
For example, gold might jump from $2,430 to $2,460, then fall back to $2,425 within minutes.
Buying the initial spike could leave you trapped near the high.
Wait for the market to settle. Mark the news candle's high and low, then watch which side price can hold.
If gold breaks the news high and holds above it, buyers may be gaining control.
If price falls below the news candle's low, the earlier rally has failed.
However, don't assume that every break will lead to a new trend. Gold can move sharply in both directions during major reports.
Also remember that spot XAU/USD has no single central exchange volume figure. Your platform's volume may reflect tick activity rather than total gold trading volume.
10. XAU/USD Technical Analysis Checklist Before Trading
Before entering a gold trade, go through these six questions.
What's the main trend? Check whether the daily chart is bullish, bearish, or moving sideways.
Where are the key levels? Mark the nearest H4 support and resistance zones.
What confirms the entry? Look for a clear M15 or H1 price action signal.
Where is the stop loss? Find the price that would prove your setup wrong.
Is the reward worth the risk? Check the next price obstacle before setting your target.
How much could you lose? Choose a position size that fits your risk limit.
If you cannot answer these questions, you may not have a complete setup.
Keep screenshots of your entries and exits. Record why you entered, which timeframe you used, and whether price followed your plan.
Review both winning and losing trades.
A profitable trade can still come from poor analysis. A losing trade can still be well planned.
Keep reviewing your trades to find which XAU/USD setups work best for you.
Ready to put your gold trading skills to the test? Pipestone Capital offers funded trading challenges with no time limit, news trading allowed, and up to $400,000 in trading capital. Trade your best setups, follow your risk plan, and keep up to 90% of your profits, with payouts available within 24 hours.
Final Thoughts
Good XAU/USD technical analysis starts with the chart, not the indicator.
Find the trend. Mark the key price zones. Wait for confirmation. Then plan your entry, stop loss, and target before placing the trade.
You won't catch every gold move, and you don't need to.
Focus on setups you understand, test them, and keep your losses controlled. That's how you get better at reading gold charts.
FAQs
Which timeframe is best for XAU/USD?
Use H4 to find setups, D1 to check the trend, and M15 to time your entry.
What's the best indicator for gold trading?
Try the 20 and 50 EMAs to spot trends. Use support and resistance to confirm your setup.
How can I spot a gold price reversal?
Watch for failed breakouts, strong price rejection, and a break of the latest swing high or low.



XAU/USD Technical Analysis: How to Read Gold Charts
Gold can move $20 or $30 in a short session. Sometimes the move starts at a clear price level. Other times, it breaks that level and turns straight back.
That's why learning how to read gold charts matters.
XAU/USD technical analysis helps traders understand where gold might move next based on past price movements. By studying candlesticks, trends, support and resistance, and market structure, you can find potential entries and exits instead of guessing.
For example, imagine gold has been climbing for several days. It reaches $2,450, pulls back to $2,420, and starts moving higher again. Is this a good buying opportunity, or could gold fall further?
The answer depends on what the chart shows. You need to check whether $2,420 is a strong support zone, whether buyers are defending it, and whether the larger trend still points upward.
The same applies when gold breaks resistance. A move above a key level might start a new rally, but it could also be a false breakout that traps buyers.
This is where price action and market structure become useful. They help you understand what buyers and sellers are doing, rather than relying on a single candle or indicator.
You don't need ten indicators to read XAU/USD charts. You need to know which price levels matter, how trends develop, and when a trading setup is no longer valid.
In this guide, we'll break down gold technical analysis step by step. You'll learn how to spot trends, draw support and resistance, identify breakouts, and use multiple timeframes. We'll also work through chart examples with entry prices, stop losses, profit targets, and risk-to-reward ratios.
All price levels below are illustrative examples, not live gold prices.
1. How to Read Gold Charts Using Candlesticks
Candlestick charts show how gold prices move within a chosen timeframe. Each candle represents a set period, whether that's five minutes, one hour, or one day.
Every candlestick shows four prices:
Open: Where gold started trading during that period.
High: The highest price reached.
Low: The lowest price reached.
Close: Where the candle finished.
A green candle means gold closed above its opening price. A red candle means it closed below.
But the candle's shape tells you more.
A long candle body often shows strong movement in one direction. A small body suggests buyers and sellers finished close to where they started.
Long wicks reveal something else. They show prices that gold reached but couldn't hold.
For example, a long upper wick near resistance suggests buyers pushed gold higher but failed to keep it there.
A long lower wick near support suggests sellers pushed gold down before buyers drove it back up.
The location of these candles matters more than their shape alone.
Technical analysis works best when it forms part of a gold trading strategy with clear risk and entry rules.
Chart Example 1: A Bullish Rejection Candle
Imagine gold approaches support at $2,400 on the 1-hour chart.
The candle shows:
Price | XAU/USD |
Open | $2,410 |
High | $2,430 |
Low | $2,392 |
Close | $2,426 |
Gold briefly fell below $2,400 but recovered and closed near its high.
That long lower wick shows buyers pushed back against the selloff.
Does this mean you should buy?
Not yet.
A bullish rejection candle warns that sellers may be losing control. It isn't proof that gold will rise.
You need to understand why the rejection happened and what price does next.
Step 1: Check Whether $2,400 Is an Important Support Level
Look at the previous candles on your H1 and H4 charts.
Suppose gold bounced from $2,400 twice during the past three trading sessions. Each time, buyers stepped in and pushed price higher.
That tells you traders are paying attention to this area.
Instead of drawing one line at $2,400, mark a support zone between $2,395 and $2,405.
Gold doesn't always reverse at an exact price. It might briefly break below support before moving back above it.
That's what happened when the candle touched $2,392 and recovered.
However, repeated tests don't guarantee support will hold. If each bounce becomes weaker, sellers may eventually break through.
Step 2: Wait for the Next Candle to Confirm the Rejection
The rejection candle closed at $2,426, just below its $2,430 high.
Now watch the next H1 candle.
Imagine it opens near $2,426, briefly pulls back, then climbs above $2,430 and closes at $2,435.
This gives you two useful signals.
First, buyers defended the $2,400 support zone. Second, they pushed gold above the rejection candle's high.
That's stronger evidence than the first candle alone.
But what if the next candle falls instead?
Suppose gold drops back to $2,400 and closes at $2,396. The rejection has failed to produce an upward move.
Buying immediately after the first green candle would have been premature.
Step 3: Find an Entry Without Chasing Price
A candle closing above $2,430 doesn't mean you must buy at once.
Check the distance to the next resistance level and your planned stop.
For example, if gold breaks above $2,430 and pulls back toward $2,425, watch whether buyers defend that area.
A higher low on M15, followed by another move upward, may provide a clearer entry.
Suppose that pullback forms a confirmed swing low at $2,418. A trader could consider an entry around $2,432, with a stop below that swing low.
The key is that the stop must sit beyond a meaningful chart level, not at a random price.
Step 4: Know When Your Analysis Is Wrong
A move below $2,392 would break the rejection candle's low.
That weakens the original bullish signal.
A tighter stop below a confirmed M15 swing low might make sense for a short-term trade. But it could be hit even while the larger H1 support zone survives.
Your stop depends on which setup you're trading.
The lesson: Don't trade a candlestick just because it has a long wick. Check its location, the next candle's reaction, and the larger trend.
2. Identify Trends Through XAU/USD Market Structure
Before drawing indicators or looking for entries, check the overall trend.
Gold moves through a series of swing highs and swing lows. These turning points help you understand whether buyers or sellers control the market.
A swing high forms when gold rises, stops, and starts pulling back. A swing low forms when price falls, finds buyers, and moves upward.
The relationship between these points reveals the market structure. Traders can then use an XAU/USD price action strategy to judge how price behaves around those levels.
For example, gold might climb from $2,400 to $2,450, pull back to $2,425, and rise again to $2,480.
The second rally reached a higher price than the first. The pullback also stopped above the previous low.
That tells you buyers are willing to enter at higher prices.
But if gold later breaks below $2,425, the short-term structure has changed.
This doesn't always mean a full downtrend has started. Gold could simply be entering a deeper pullback.
You need to watch the next swing high and low before deciding.
Bullish Market Structure: Higher Highs and Higher Lows
An uptrend forms when gold keeps making higher highs (HH) and higher lows (HL).
Chart Example 2: Reading a Gold Uptrend
Imagine the daily XAU/USD chart shows this sequence:
Price movement | Market structure |
$2,360 → $2,425 | First swing high |
$2,425 → $2,390 | Higher low |
$2,390 → $2,470 | Higher high |
$2,470 → $2,440 | New higher low |
Buyers remain in control while gold holds its main swing lows.
Instead of buying at $2,470 after a strong rally, you could wait for a pullback toward $2,440.
That gives you a clearer entry and a closer point for your stop loss.
If gold breaks below $2,440, the latest higher low has failed. A deeper move below $2,390 would weaken the broader bullish structure further.
Bearish Market Structure: Lower Highs and Lower Lows
A downtrend is the opposite.
Gold makes lower highs and lower lows. Each rally fails below the previous high, and sellers push price lower.
Imagine gold falls from $2,480 to $2,420, then rebounds to $2,450.
It fails to reach the previous $2,480 high and drops to $2,390.
This creates a lower high followed by a lower low.
Instead of buying every dip, a trader might watch for a rally toward 2,440–2,450.
If sellers return near that area, it could offer a short setup with the downtrend.
How to Spot a Possible Trend Reversal
A break in market structure can warn that a trend is losing strength.
Suppose gold is making lower highs at $2,460 and $2,440.
It then breaks above $2,440, forms a higher low, and climbs past $2,460.
The earlier bearish pattern has changed.
Still, one break isn't enough to confirm a lasting reversal. Check whether gold can hold the new support and keep making higher lows.
This is one of the most useful parts of XAU/USD technical analysis. You're reading how price behaves rather than trying to predict every move.
3. Find Support and Resistance on Gold Charts
Support and resistance are among the most useful tools in gold technical analysis.
Support is an area where buyers have previously stepped in.
Resistance is an area where sellers have previously stopped a rally.
Treat them as price zones, not exact lines.
When drawing these zones, look for areas where gold has reversed several times.
Start with the daily chart. Mark the clearest swing highs and lows, then move to H4 for a closer look.
Avoid filling your chart with dozens of horizontal lines. Focus on the levels that price has reacted to most clearly.
Traders can use a XAU/USD support and resistance strategy to identify areas where XAU/USD has reacted several times.
Chart Example 3: Support Turning Into Resistance
Suppose gold has repeatedly bounced between $2,398 and $2,405.
You mark that area as support.
Gold then breaks below $2,398 and closes at $2,385.
Later, price rallies back toward $2,400 but fails to move higher.
The old support has become resistance.
A trader might watch for a bearish candle near $2,400 before considering a short trade.
However, if gold closes back above $2,405 and holds there, the bearish setup loses strength.
How to Tell Whether a Gold Price Level Is Strong
Look at three things.
First, check how price reacted there before. Sharp moves away from a zone show that it mattered at the time.
Second, check the timeframe. A major daily support zone generally deserves more attention than a minor level on M5.
Third, look at how gold approaches it.
A slow pullback with smaller candles differs from a sharp selloff with several large bearish candles.
If gold drops straight into support with strong selling, don't assume buyers will stop it.
Wait to see how price reacts.
Practical tip: Mark support and resistance on D1 and H4 first. Then use H1 or M15 to study the candles forming around those areas.
4. Use Multiple Timeframes for Gold Technical Analysis
One chart rarely tells the full story.
A 15-minute chart might show a downtrend while the daily chart remains bullish.
Both can be correct.
The daily chart might be showing a major uptrend, while M15 captures a short pullback inside it.
This is why traders use multiple timeframe analysis.
Timeframe | What to look for |
Daily (D1) | Main trend and major price levels |
4-hour (H4) | Pullbacks, swing highs, and support zones |
15-minute (M15) | Entry signals and stop-loss placement |
Chart Example 4: A Multi-Timeframe Gold Buy Setup
Gold is bullish on the daily chart.
On H4, price pulls back from $2,490 toward support between $2,450 and $2,456.
Switch to M15.
Gold briefly falls to $2,447, climbs back above support, and closes at $2,460.
You now have three pieces of information.
The daily trend favors buyers. The H4 chart shows a pullback into support. The M15 chart shows buyers returning.
This is stronger than buying simply because one green candle appeared.
What If the Timeframes Disagree?
Suppose D1 remains bullish, but H4 keeps making lower highs.
That suggests gold is still correcting.
You could wait for H4 to stop making lower lows before looking for long trades.
There's no need to force an entry when the charts disagree.
The goal isn't to make every timeframe look bullish or bearish. It's to understand which trend you're trading and where your entry fits inside it.
5. Four Practical XAU/USD Technical Analysis Trading Setups
Reading gold charts becomes more useful when you can turn your analysis into a trading plan.
The following examples show four setups traders commonly watch.
Each includes an entry, stop loss, target, and risk-to-reward ratio.
Setup 1: Trading a Gold Pullback in an Uptrend
Use the bullish scenario from our earlier example.
Gold has recovered from its pullback and closed above $2,460.
Example trade plan:
Trade details | Price |
Entry | $2,461 |
Stop loss | $2,444 |
First resistance | $2,490 |
Final target | $2,495 |
Risk | $17 per ounce |
Potential reward | $34 per ounce |
Risk-to-reward ratio | 1:2 |
Why does this setup make sense?
You're trading with the larger trend, not against it.
Your stop sits below the recent pullback low. If price falls through that area, the bullish idea is weakened.
The previous high at $2,490 is your first obstacle.
If gold struggles there, you may choose to take profit rather than wait for $2,495.
Don't force the trade if the entry rises too far from support.
Setup 2: Trading a Gold Breakout and Retest
A breakout happens when gold moves beyond an established price level.
But not every breakout lasts.
Imagine gold has tested resistance between $2,470 and $2,478 three times.
On the H1 chart, price finally closes at $2,486.
Instead of chasing that candle, wait.
Gold pulls back to $2,474, then rebounds and closes above $2,482.
The old resistance is now acting as support.
Example trade plan:
Trade details | Price |
Entry | $2,482 |
Stop loss | $2,463 |
Target | $2,520 |
Risk | $19 |
Potential reward | $38 |
Risk-to-reward ratio | 1:2 |
The retest helps show whether buyers can defend the breakout.
If gold closes back below the former resistance zone and fails to recover, avoid forcing a long trade.
Also check the space above your entry. Nearby resistance could limit the move.
Setup 3: Spotting a False Breakout on XAU/USD
False breakouts are common on gold charts.
Price moves beyond a level, attracts traders, then reverses.
Imagine resistance sits near $2,465.
Gold spikes to $2,478 but closes back at $2,458.
That's your first warning.
On M15, price then forms a lower high at $2,464 and breaks below $2,455.
Sellers may be taking control.
Example trade plan:
Trade details | Price |
Entry | $2,453 |
Stop loss | $2,469 |
Target | $2,421 |
Risk | $16 |
Potential reward | $32 |
Risk-to-reward ratio | 1:2 |
The stop sits above the new lower high. A move back above it weakens the short-term bearish setup.
Notice that you didn't sell the first spike.
You waited for price to reject resistance, form a lower high, and break short-term support.
That extra confirmation can help avoid entering too early.
Setup 4: Trading Gold in a Sideways Range
Gold doesn't always trend.
Sometimes it moves between support and resistance for hours or days.
Imagine H1 shows a range between $2,390 and $2,430.
Gold tests $2,390 several times but cannot hold below it.
On M15, price briefly falls to $2,389, recovers, and closes at $2,396.
Example trade plan:
Trade details | Price |
Entry | $2,396 |
Stop loss | $2,385 |
Target | $2,422 |
Risk | $11 |
Potential reward | $26 |
Risk-to-reward ratio | Approximately 1:2.4 |
The plan is to buy near the range floor and take profit before resistance.
But if gold starts closing below $2,390, the range may be breaking down.
Don't keep buying just because support worked yesterday.
6. Best Indicators to Support XAU/USD Chart Analysis
Indicators can help you read a gold chart. They shouldn't make every trading decision.
Three tools are worth learning.
20 EMA and 50 EMA: Reading Gold Trends
Moving averages help show trend direction.
When the 20 EMA is above the 50 EMA and both slope upward, short-term momentum supports buyers.
Watch how gold behaves when it pulls back toward them.
For example, gold could fall from $2,480 to the rising 20 EMA near $2,450.
If that area also matches H4 support, the level deserves attention.
But a moving-average touch alone isn't an entry signal.
Wait for price to respond.
If gold breaks below both averages and starts forming lower highs, the earlier trend may be weakening.
RSI: Spotting Momentum Changes
The Relative Strength Index (RSI) measures momentum from 0 to 100.
Readings above 70 are often called overbought. Below 30 is considered oversold.
Neither guarantees a reversal.
Gold can remain above 70 during a strong rally. Selling every time RSI reaches that level can put you against the trend.
A better way to use RSI is to compare its movement with price.
Chart Example 5: Bearish RSI Divergence
Gold makes a high at $2,470 while RSI reaches 77.
Later, gold rises to $2,485, but RSI peaks at only 66.
Price made a higher high. RSI made a lower high.
This is bearish divergence.
It suggests the rally has lost some strength.
However, gold can keep rising despite divergence. Look for a break below a recent swing low before treating it as stronger bearish evidence.
ATR: Measuring Gold Price Volatility
Average True Range (ATR) measures how much price typically moves per candle.
Suppose H1 ATR reads $12.
A $3 stop may be too tight for the current market conditions.
Gold could move against you by $3 during an ordinary pullback before continuing in your expected direction.
ATR doesn't tell you which way to trade. It helps you judge whether your stop has enough room.
Use nearby market structure to choose the stop, then check whether that distance fits your risk limit. Indicators can add extra context to a chart, but the best indicator for XAUUSD trading depends on what the trader wants to measure.
7. How to Read Gold Chart Patterns
Gold traders often watch double tops, double bottoms, triangles, and flags.
These patterns can help you spot possible breakouts and reversals.
But avoid trading a pattern before it has formed.
Double Top: A Possible Bearish Reversal
Imagine gold reaches $2,460, drops to $2,430, then rallies back toward $2,460.
The second rally fails.
This forms two highs near the same price.
However, two peaks alone don't confirm a reversal.
The key level is the neckline near $2,430.
If gold closes below it and fails to recover, the bearish pattern has stronger confirmation.
A measured target would be around $2,400, based on the roughly $30 height of the pattern.
Treat that target as an estimate, not a promise.
Double Bottom: A Possible Bullish Reversal
Now imagine gold falls to $2,390, rebounds to $2,420, and drops back toward $2,390.
Buyers defend that support zone again.
If price later breaks above $2,420, the pattern gains strength.
A measured target could be around $2,450, though nearby resistance may stop the move sooner.
The key is to wait for price to break the neckline rather than buying simply because two lows look similar.
Gold Flags and Triangle Breakouts
A bullish flag can form after a strong rally.
Gold rises sharply, then moves sideways or pulls back in a narrow channel.
If price breaks above that channel, the earlier rally may continue.
Triangles work in a similar way. Price swings become smaller as gold moves toward a narrower range.
When gold finally breaks out, watch the candle close and any retest.
A breakout without follow-through can quickly turn into a losing trade.
Chart patterns work best when they match the larger trend and form near meaningful price levels.
8. Manage Risk Before Placing a Gold Trade
Even a strong XAU/USD technical analysis setup can fail.
Risk management keeps one losing trade from doing too much damage.
Suppose your trading account has $5,000, and you risk 1% per trade.
Your maximum planned loss is $50.
You want to buy gold at $2,461, with a stop at $2,446.
That's $15 risk per ounce.
Assuming a standard XAU/USD contract of 100 ounces per lot, a 0.03-lot position equals three ounces.
A $15 move against three ounces means a $45 loss before fees and slippage.
Always check your broker's contract size, spread, and execution rules. They can differ.
Calculate Risk Before Choosing Your Lot Size
A common mistake is choosing a position size first, then placing a stop wherever it fits.
Do the opposite.
Find the price that would prove your setup wrong. Measure the distance from your entry. Then choose a lot size that keeps your planned loss within your limit.
If the correct stop is too far away for your account size, reduce the position or skip the trade.
Never move your stop farther away simply because gold is approaching it.
9. Be Careful Around Major Economic News
Gold can react sharply to US inflation reports, jobs data, and Federal Reserve decisions.
A strong candle during news doesn't always signal a lasting trend.
For example, gold might jump from $2,430 to $2,460, then fall back to $2,425 within minutes.
Buying the initial spike could leave you trapped near the high.
Wait for the market to settle. Mark the news candle's high and low, then watch which side price can hold.
If gold breaks the news high and holds above it, buyers may be gaining control.
If price falls below the news candle's low, the earlier rally has failed.
However, don't assume that every break will lead to a new trend. Gold can move sharply in both directions during major reports.
Also remember that spot XAU/USD has no single central exchange volume figure. Your platform's volume may reflect tick activity rather than total gold trading volume.
10. XAU/USD Technical Analysis Checklist Before Trading
Before entering a gold trade, go through these six questions.
What's the main trend? Check whether the daily chart is bullish, bearish, or moving sideways.
Where are the key levels? Mark the nearest H4 support and resistance zones.
What confirms the entry? Look for a clear M15 or H1 price action signal.
Where is the stop loss? Find the price that would prove your setup wrong.
Is the reward worth the risk? Check the next price obstacle before setting your target.
How much could you lose? Choose a position size that fits your risk limit.
If you cannot answer these questions, you may not have a complete setup.
Keep screenshots of your entries and exits. Record why you entered, which timeframe you used, and whether price followed your plan.
Review both winning and losing trades.
A profitable trade can still come from poor analysis. A losing trade can still be well planned.
Keep reviewing your trades to find which XAU/USD setups work best for you.
Ready to put your gold trading skills to the test? Pipestone Capital offers funded trading challenges with no time limit, news trading allowed, and up to $400,000 in trading capital. Trade your best setups, follow your risk plan, and keep up to 90% of your profits, with payouts available within 24 hours.
Final Thoughts
Good XAU/USD technical analysis starts with the chart, not the indicator.
Find the trend. Mark the key price zones. Wait for confirmation. Then plan your entry, stop loss, and target before placing the trade.
You won't catch every gold move, and you don't need to.
Focus on setups you understand, test them, and keep your losses controlled. That's how you get better at reading gold charts.
FAQs
Which timeframe is best for XAU/USD?
Use H4 to find setups, D1 to check the trend, and M15 to time your entry.
What's the best indicator for gold trading?
Try the 20 and 50 EMAs to spot trends. Use support and resistance to confirm your setup.
How can I spot a gold price reversal?
Watch for failed breakouts, strong price rejection, and a break of the latest swing high or low.
