


Gold Support and Resistance Strategy: How to Trade XAU/USD Levels

A Simple Gold Support and Resistance Strategy
Finding levels is only the first part.
The next step is deciding how to trade them.
Here is a simple process.
Step 1: Check the Higher-Timeframe Trend
Start with a higher timeframe such as the four-hour or daily chart.
Ask one question:
Is gold trending higher, trending lower, or ranging?
If gold is trending higher, buying support often makes more sense than selling every resistance level.
If gold is trending lower, resistance may offer better short setups.
When gold is ranging, traders may look for trades in both directions.
This keeps your trades aligned with the larger price structure.
Step 2: Mark Important Levels
Draw your strongest support and resistance areas.
Avoid marking every small swing.
Three or four useful zones are better than fifteen weak ones.
Good levels may include:
A major daily swing high
A major daily swing low
The previous day's high or low
A major breakout zone
A nearby round number
Now wait for price to reach one of them.
Step 3: Wait for Confirmation
Do not enter just because price touches support.
Gold can break straight through it.
Instead, look for signs that buyers or sellers are responding.
Common signals include:
Pin bars
Long rejection wicks
Bullish or bearish engulfing candles
Failed breakouts
Break-and-retest patterns
Lower-timeframe structure changes
Suppose gold falls toward support.
Price trades slightly below the zone but quickly returns above it. A strong bullish candle then forms.
That rejection gives more information than the level alone.
Step 4: Plan the Stop Loss
A stop loss should sit where the trade idea becomes invalid.
For a support trade, that may be below the support zone.
For a resistance trade, it may be above resistance.
Do not place the stop directly on the level.
Gold often moves beyond support or resistance before reversing.
Your position size should then be based on the stop distance and your chosen risk.
Step 5: Choose the Target Before Entering
The next major price level can provide a logical target.
If buying from support, the next resistance zone may become the target.
If selling resistance, the next support zone may become the target.
This makes the trade easier to assess before risking money.
A setup with limited upside and a large stop may not be worth taking.
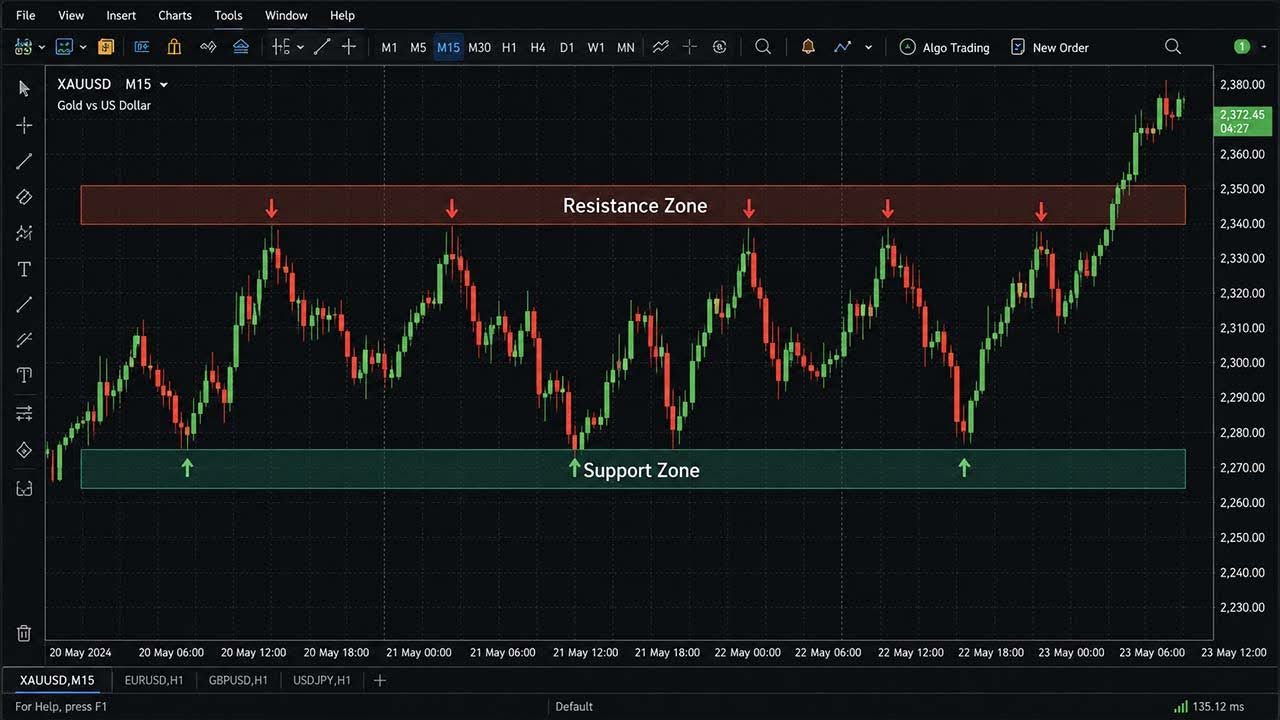
Example of a Gold Support Trade
Assume XAU/USD is in an uptrend.
Price has been creating higher highs and higher lows.
You identify support around $3,350 from a previous breakout.
Gold later pulls back toward that area.
Instead of buying immediately, you wait.
Price trades below $3,350 briefly and then moves back above it. A bullish rejection candle appears on the 15-minute chart.
A possible plan could look like this:
Support zone: Around $3,350
Entry: After bullish confirmation
Stop: Below the recent rejection low
Target: Next major resistance
Trade direction: Long
The important part is not the example price.
The process matters more.
You identified the trend, marked support, waited for confirmation, and planned your risk.
Example of a Gold Resistance Trade
Now assume gold is trending lower.
Price repeatedly forms lower highs.
You identify resistance around a previous breakdown area.
Gold rallies back toward that zone during the New York session.
The first touch does not trigger a trade.
Price pushes slightly above resistance before falling back below it. A bearish candle then closes under the zone.
That failed breakout may confirm that sellers remain active.
A trader could enter short after confirmation.
The stop may sit above the rejection high.
The next support area could provide the target.
This approach avoids trying to predict the exact turning point.
You wait until the market shows evidence first.

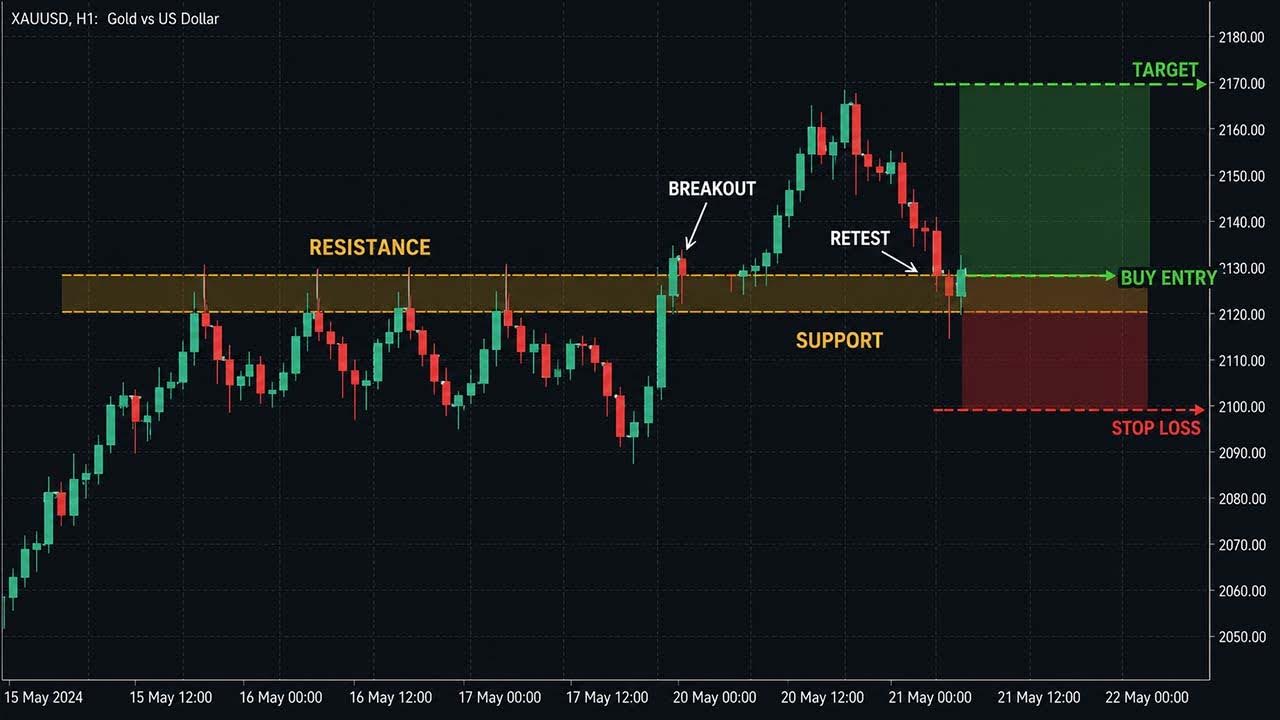
Support and Resistance Breakout Strategy
Support and resistance can also be traded when they fail.
A strong breakout shows that one side of the market has taken control.
Suppose gold repeatedly tests resistance.
Each pullback becomes smaller.
Price eventually closes clearly above the resistance zone.
Buying the first candle above resistance can be risky.
Gold often produces false breakouts.
A safer approach is waiting for a retest.
The process looks like this:
Identify strong resistance.
Wait for a clear close above it.
Let price return toward the broken level.
Watch for the old resistance to hold as support.
Enter after bullish confirmation.
Place the stop below the new support structure.
Target the next major resistance area.
The same setup works in reverse for bearish breakdowns.
How to Avoid False Breakouts in Gold
False breakouts are common with XAU/USD.
Gold can move above resistance, trigger buy orders, and then reverse sharply.
The same thing can happen below support.
You cannot remove false breakouts completely.
You can reduce poor entries by waiting for more evidence.
Look for a candle close
A wick through resistance is not the same as a breakout.
Waiting for the candle to close above the zone can filter some weak moves.
Watch the retest
Strong breakouts often hold the broken level during a pullback.
If price immediately collapses back through the zone, the breakout may have failed.
Check the wider trend
A bullish breakout that agrees with a strong uptrend often has better structure.
Breaking resistance against a strong downtrend requires more care.
Watch major news
Gold can become very volatile around:
US CPI reports
Non-Farm Payrolls
Federal Reserve meetings
Interest rate decisions
Major geopolitical events
Price can break several technical levels within minutes.
A good chart setup can fail simply because volatility suddenly increases.
Common Gold Support and Resistance Mistakes
Even simple strategies can go wrong when traders force setups.
Here are five mistakes to avoid.
1. Drawing too many levels
More lines do not create better analysis.
Focus on areas with clear past reactions.
2. Treating levels as exact prices
Gold often moves through a level before reversing.
Use zones instead of one-pixel horizontal lines.
3. Entering without confirmation
Touching support does not mean price must rise.
Let price show that buyers are responding.
4. Ignoring the larger trend
Repeatedly selling resistance during a powerful gold rally can become expensive.
Start with higher-timeframe structure.
5. Moving the stop after entering
Do not widen a stop simply because price moves against you.
The stop should represent the point where your setup is no longer valid.
Which Timeframe Is Best for XAU/USD Support and Resistance?
There is no single best timeframe.
It depends on how you trade.
Daily and four-hour charts are useful for finding major levels.
One-hour charts can help refine market structure.
15-minute and five-minute charts can help with entry timing.
A simple approach is:
Daily chart: Find major market direction
4-hour chart: Mark key support and resistance
1-hour chart: Watch price structure
15-minute chart: Look for entry confirmation
This gives you both the larger picture and a clearer entry.
Very low timeframes can contain more noise.
A level that looks important on a one-minute chart may mean little on the four-hour chart.

Risk Management When Trading Gold Levels
A good level does not remove risk.
Every support zone can break.
Every resistance zone can fail.
Risk should be decided before entering the trade.
Consider these rules:
Use a fixed risk amount per trade.
Place stops beyond the invalidation area.
Reduce position size when stops are wider.
Avoid chasing price after it leaves the level.
Check major news before entering.
Avoid stacking several trades around the same idea.
This becomes even more important when trading a funded account.
A few oversized gold trades can quickly damage an account when XAU/USD becomes volatile.
At Pipstone Capital, traders can access funded trading programs without time limits or consistency rules on eligible accounts. That still makes risk control important. The aim should be protecting the account while waiting for clear setups.
Gold Support and Resistance Strategy Checklist
Before entering an XAU/USD trade, check these points:
Is the higher-timeframe direction clear?
Is the support or resistance level easy to identify?
Has price reacted there before?
Is the level also near a swing point or round number?
Has price reached the zone yet?
Is there clear entry confirmation?
Where does the trade idea become invalid?
Is the stop placed beyond that area?
Is there enough room before the next major level?
Is major economic news approaching?
If several answers are unclear, skipping the trade may be the better choice. Support and resistance works best when it forms part of a broader XAU/USD trading strategy with clear entry and risk rules.
Final Thoughts
A Gold Support and Resistance Strategy gives XAU/USD traders a simple way to organize price action.
The goal is not to predict every gold reversal.
Find areas where buyers or sellers previously became active. Then watch how price behaves when it returns.
Strong setups often combine several factors.
You may have a higher-timeframe trend, a clear support zone, a round number, and a strong rejection candle.
That is much stronger than buying because price touched one horizontal line.
Keep your charts clean. Wait for confirmation. Place stops where the setup becomes invalid.
Most importantly, treat support and resistance as areas of interest rather than guaranteed turning points.
That approach makes XAU/USD support and resistance much more useful for real trading decisions.
Frequently Asked Questions
What is the best support and resistance strategy for gold?
Mark major swing levels on higher timeframes, then wait for price confirmation before entering. Rejection candles and breakout retests can help confirm the setup.
Does support and resistance work on XAU/USD?
Yes. Gold often reacts around previous highs, lows, breakout areas, and round numbers. No level works every time, so risk management remains essential.
Which timeframe is best for gold support and resistance?
Four-hour and daily charts work well for major levels. One-hour and 15-minute charts can then help refine entries.
How do you know if gold support will hold?
You cannot know in advance. Wait for evidence such as rejection wicks, bullish candles, failed breakdowns, or a change in lower-timeframe structure.
Should I buy gold every time it reaches support?
No. Support can break. Wait for price to react and confirm that buyers are defending the area before considering an entry.



Gold Support and Resistance Strategy: How to Trade XAU/USD Levels
A Simple Gold Support and Resistance Strategy
Finding levels is only the first part.
The next step is deciding how to trade them.
Here is a simple process.
Step 1: Check the Higher-Timeframe Trend
Start with a higher timeframe such as the four-hour or daily chart.
Ask one question:
Is gold trending higher, trending lower, or ranging?
If gold is trending higher, buying support often makes more sense than selling every resistance level.
If gold is trending lower, resistance may offer better short setups.
When gold is ranging, traders may look for trades in both directions.
This keeps your trades aligned with the larger price structure.
Step 2: Mark Important Levels
Draw your strongest support and resistance areas.
Avoid marking every small swing.
Three or four useful zones are better than fifteen weak ones.
Good levels may include:
A major daily swing high
A major daily swing low
The previous day's high or low
A major breakout zone
A nearby round number
Now wait for price to reach one of them.
Step 3: Wait for Confirmation
Do not enter just because price touches support.
Gold can break straight through it.
Instead, look for signs that buyers or sellers are responding.
Common signals include:
Pin bars
Long rejection wicks
Bullish or bearish engulfing candles
Failed breakouts
Break-and-retest patterns
Lower-timeframe structure changes
Suppose gold falls toward support.
Price trades slightly below the zone but quickly returns above it. A strong bullish candle then forms.
That rejection gives more information than the level alone.
Step 4: Plan the Stop Loss
A stop loss should sit where the trade idea becomes invalid.
For a support trade, that may be below the support zone.
For a resistance trade, it may be above resistance.
Do not place the stop directly on the level.
Gold often moves beyond support or resistance before reversing.
Your position size should then be based on the stop distance and your chosen risk.
Step 5: Choose the Target Before Entering
The next major price level can provide a logical target.
If buying from support, the next resistance zone may become the target.
If selling resistance, the next support zone may become the target.
This makes the trade easier to assess before risking money.
A setup with limited upside and a large stop may not be worth taking.
Example of a Gold Support Trade
Assume XAU/USD is in an uptrend.
Price has been creating higher highs and higher lows.
You identify support around $3,350 from a previous breakout.
Gold later pulls back toward that area.
Instead of buying immediately, you wait.
Price trades below $3,350 briefly and then moves back above it. A bullish rejection candle appears on the 15-minute chart.
A possible plan could look like this:
Support zone: Around $3,350
Entry: After bullish confirmation
Stop: Below the recent rejection low
Target: Next major resistance
Trade direction: Long
The important part is not the example price.
The process matters more.
You identified the trend, marked support, waited for confirmation, and planned your risk.
Example of a Gold Resistance Trade
Now assume gold is trending lower.
Price repeatedly forms lower highs.
You identify resistance around a previous breakdown area.
Gold rallies back toward that zone during the New York session.
The first touch does not trigger a trade.
Price pushes slightly above resistance before falling back below it. A bearish candle then closes under the zone.
That failed breakout may confirm that sellers remain active.
A trader could enter short after confirmation.
The stop may sit above the rejection high.
The next support area could provide the target.
This approach avoids trying to predict the exact turning point.
You wait until the market shows evidence first.
Support and Resistance Breakout Strategy
Support and resistance can also be traded when they fail.
A strong breakout shows that one side of the market has taken control.
Suppose gold repeatedly tests resistance.
Each pullback becomes smaller.
Price eventually closes clearly above the resistance zone.
Buying the first candle above resistance can be risky.
Gold often produces false breakouts.
A safer approach is waiting for a retest.
The process looks like this:
Identify strong resistance.
Wait for a clear close above it.
Let price return toward the broken level.
Watch for the old resistance to hold as support.
Enter after bullish confirmation.
Place the stop below the new support structure.
Target the next major resistance area.
The same setup works in reverse for bearish breakdowns.
How to Avoid False Breakouts in Gold
False breakouts are common with XAU/USD.
Gold can move above resistance, trigger buy orders, and then reverse sharply.
The same thing can happen below support.
You cannot remove false breakouts completely.
You can reduce poor entries by waiting for more evidence.
Look for a candle close
A wick through resistance is not the same as a breakout.
Waiting for the candle to close above the zone can filter some weak moves.
Watch the retest
Strong breakouts often hold the broken level during a pullback.
If price immediately collapses back through the zone, the breakout may have failed.
Check the wider trend
A bullish breakout that agrees with a strong uptrend often has better structure.
Breaking resistance against a strong downtrend requires more care.
Watch major news
Gold can become very volatile around:
US CPI reports
Non-Farm Payrolls
Federal Reserve meetings
Interest rate decisions
Major geopolitical events
Price can break several technical levels within minutes.
A good chart setup can fail simply because volatility suddenly increases.
Common Gold Support and Resistance Mistakes
Even simple strategies can go wrong when traders force setups.
Here are five mistakes to avoid.
1. Drawing too many levels
More lines do not create better analysis.
Focus on areas with clear past reactions.
2. Treating levels as exact prices
Gold often moves through a level before reversing.
Use zones instead of one-pixel horizontal lines.
3. Entering without confirmation
Touching support does not mean price must rise.
Let price show that buyers are responding.
4. Ignoring the larger trend
Repeatedly selling resistance during a powerful gold rally can become expensive.
Start with higher-timeframe structure.
5. Moving the stop after entering
Do not widen a stop simply because price moves against you.
The stop should represent the point where your setup is no longer valid.
Which Timeframe Is Best for XAU/USD Support and Resistance?
There is no single best timeframe.
It depends on how you trade.
Daily and four-hour charts are useful for finding major levels.
One-hour charts can help refine market structure.
15-minute and five-minute charts can help with entry timing.
A simple approach is:
Daily chart: Find major market direction
4-hour chart: Mark key support and resistance
1-hour chart: Watch price structure
15-minute chart: Look for entry confirmation
This gives you both the larger picture and a clearer entry.
Very low timeframes can contain more noise.
A level that looks important on a one-minute chart may mean little on the four-hour chart.
Risk Management When Trading Gold Levels
A good level does not remove risk.
Every support zone can break.
Every resistance zone can fail.
Risk should be decided before entering the trade.
Consider these rules:
Use a fixed risk amount per trade.
Place stops beyond the invalidation area.
Reduce position size when stops are wider.
Avoid chasing price after it leaves the level.
Check major news before entering.
Avoid stacking several trades around the same idea.
This becomes even more important when trading a funded account.
A few oversized gold trades can quickly damage an account when XAU/USD becomes volatile.
At Pipstone Capital, traders can access funded trading programs without time limits or consistency rules on eligible accounts. That still makes risk control important. The aim should be protecting the account while waiting for clear setups.
Gold Support and Resistance Strategy Checklist
Before entering an XAU/USD trade, check these points:
Is the higher-timeframe direction clear?
Is the support or resistance level easy to identify?
Has price reacted there before?
Is the level also near a swing point or round number?
Has price reached the zone yet?
Is there clear entry confirmation?
Where does the trade idea become invalid?
Is the stop placed beyond that area?
Is there enough room before the next major level?
Is major economic news approaching?
If several answers are unclear, skipping the trade may be the better choice. Support and resistance works best when it forms part of a broader XAU/USD trading strategy with clear entry and risk rules.
Final Thoughts
A Gold Support and Resistance Strategy gives XAU/USD traders a simple way to organize price action.
The goal is not to predict every gold reversal.
Find areas where buyers or sellers previously became active. Then watch how price behaves when it returns.
Strong setups often combine several factors.
You may have a higher-timeframe trend, a clear support zone, a round number, and a strong rejection candle.
That is much stronger than buying because price touched one horizontal line.
Keep your charts clean. Wait for confirmation. Place stops where the setup becomes invalid.
Most importantly, treat support and resistance as areas of interest rather than guaranteed turning points.
That approach makes XAU/USD support and resistance much more useful for real trading decisions.
Frequently Asked Questions
What is the best support and resistance strategy for gold?
Mark major swing levels on higher timeframes, then wait for price confirmation before entering. Rejection candles and breakout retests can help confirm the setup.
Does support and resistance work on XAU/USD?
Yes. Gold often reacts around previous highs, lows, breakout areas, and round numbers. No level works every time, so risk management remains essential.
Which timeframe is best for gold support and resistance?
Four-hour and daily charts work well for major levels. One-hour and 15-minute charts can then help refine entries.
How do you know if gold support will hold?
You cannot know in advance. Wait for evidence such as rejection wicks, bullish candles, failed breakdowns, or a change in lower-timeframe structure.
Should I buy gold every time it reaches support?
No. Support can break. Wait for price to react and confirm that buyers are defending the area before considering an entry.
