Best Indicator for Gold Trading: What Traders Use in Volatility

Gold has always behaved differently from most trading instruments. While currency pairs often follow structured technical flows, XAUUSD tends to move fast, react sharply to global events, and shift direction when traders least expect it. Inflation headlines, interest-rate decisions, geopolitical tension, and shifts in risk sentiment can all trigger sudden volatility.
Because of this, one question continues to dominate trader discussions:
What is the best indicator for gold trading when markets become unpredictable?
The reality is that gold rewards preparation rather than prediction. Traders who succeed in volatile environments understand how indicators work together to interpret trend strength, momentum, and participation instead of relying on a single signal.
This guide explains what professionals actually mean when they talk about the best indicator for gold trading, and why experienced traders focus on combinations rather than shortcuts.

Why Gold Trading Requires Specialized Indicators
Gold is not simply another forex pair. It acts simultaneously as a commodity, a hedge against inflation, and a global safe-haven asset. When uncertainty rises, institutional capital flows into gold rapidly, creating aggressive price expansion. During quieter periods, price may compress tightly before breaking into explosive moves.
These characteristics create:
Sudden volatility spikes
Strong directional trends followed by sharp reversals
Emotion-driven trading behavior
Because of this, many traditional strategies fail. Traders searching for the best indicator for gold trading quickly learn that slower lagging tools struggle to keep up with rapid price movement.
Instead, successful traders use indicators to confirm what price is already showing rather than trying to predict where it will go next. For newer traders, learning foundational concepts from structured forex trading tips for beginner traders can help build context before applying advanced gold indicators.
What Defines the Best Indicator for Gold Trading?
Not every indicator adapts well to XAUUSD. The best indicators for trading gold share several important traits:
They respond quickly during volatility
They clearly identify trend direction
They measure momentum strength
They help filter false breakouts
They remain reliable across timeframes
Indicators that provide overlapping information usually add confusion rather than clarity. The goal is balance — each tool should answer a different market question.
The Truth: There Is No Single Perfect Tool
Many beginners search endlessly for the best indicator for gold trading as if one setting guarantees profitable entries. Professional traders approach markets differently.
Instead of asking which indicator is best, they focus on understanding:
Is gold trending or consolidating?
Is momentum strengthening or fading?
Are institutions participating in the move?
Each indicator contributes a piece of that puzzle. When multiple signals align, probability improves. Traders who want to go deeper often study how indicators fit inside a structured gold trading strategy for XAU/USD to understand when different tools perform best.
Moving Averages: The Backbone of Gold Analysis
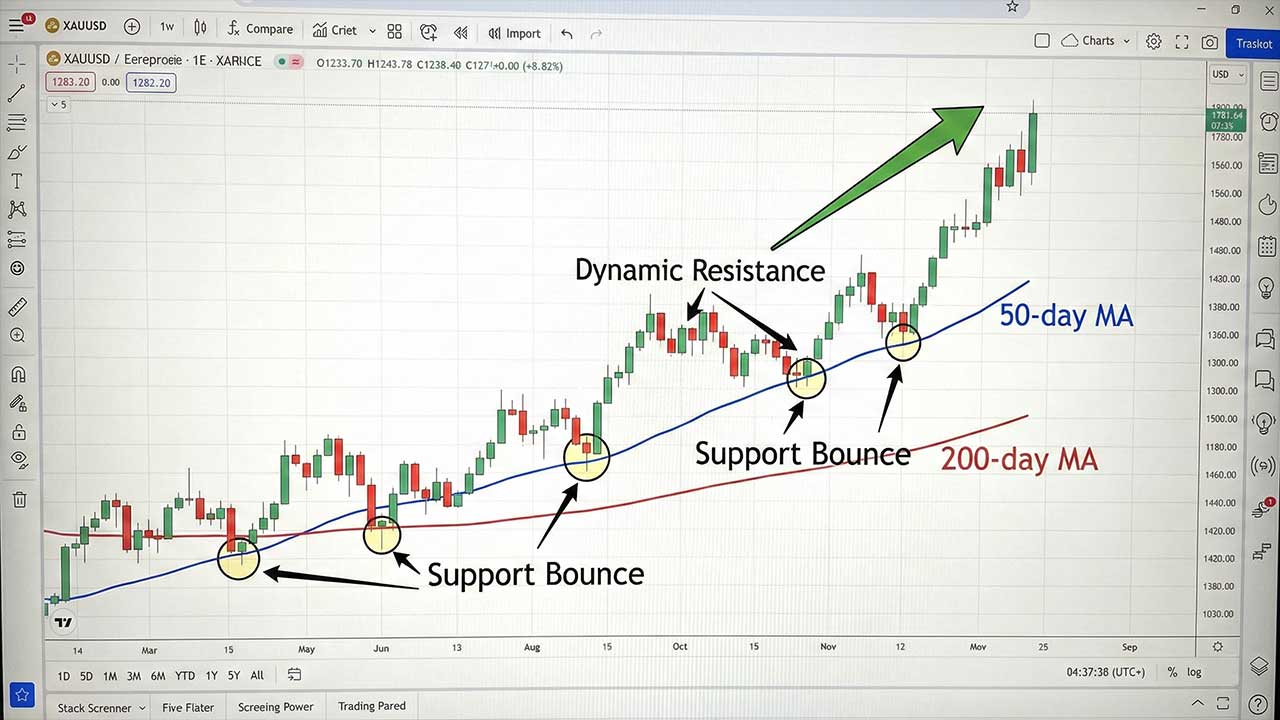
Moving averages remain among the best indicators for trading gold because they simplify market direction.
Popular setups include:
20 and 50 EMA for short-term momentum
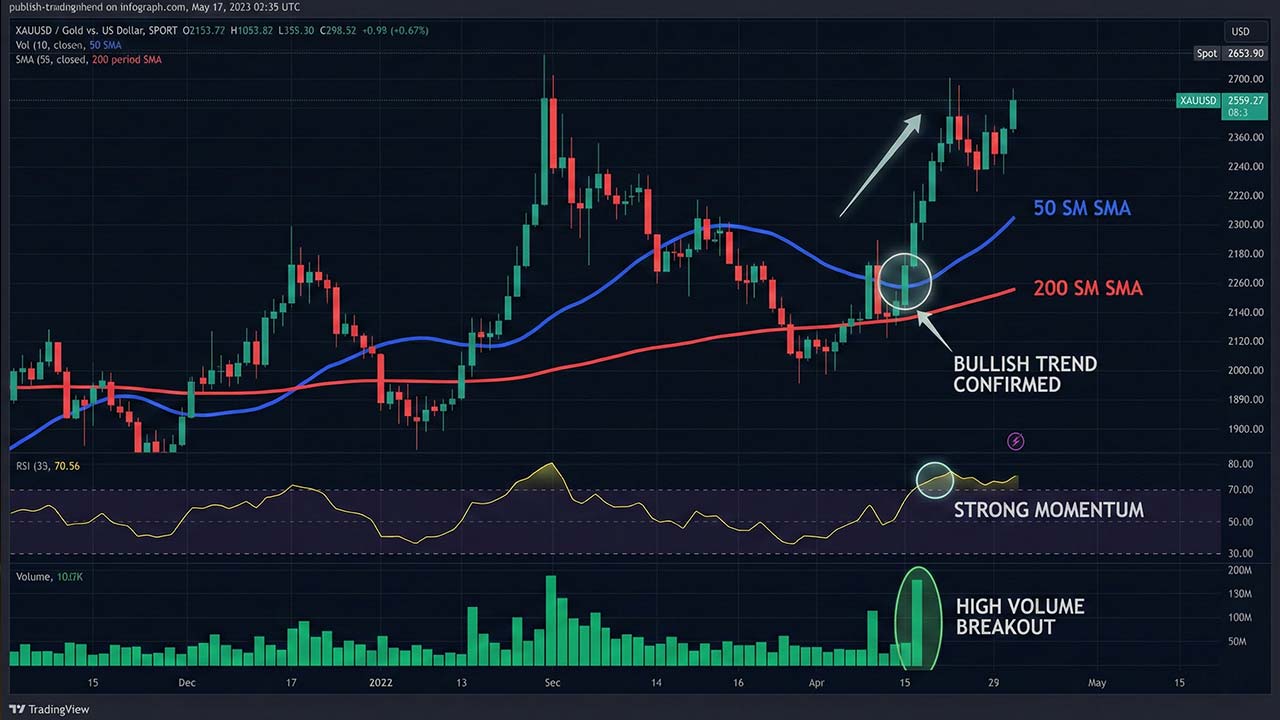
50 and 200 SMA for long-term trend confirmation
Gold frequently reacts to higher-timeframe averages as dynamic support or resistance. Rather than relying solely on crossover signals, traders observe how price behaves around these levels.
Adaptive moving averages are especially useful during volatile conditions because they adjust sensitivity as market speed changes. This adaptability is one reason many traders consider them part of the best indicator for gold trading framework. Many traders combine these signals with clearly defined stop loss and take profit levels to manage volatility more effectively.
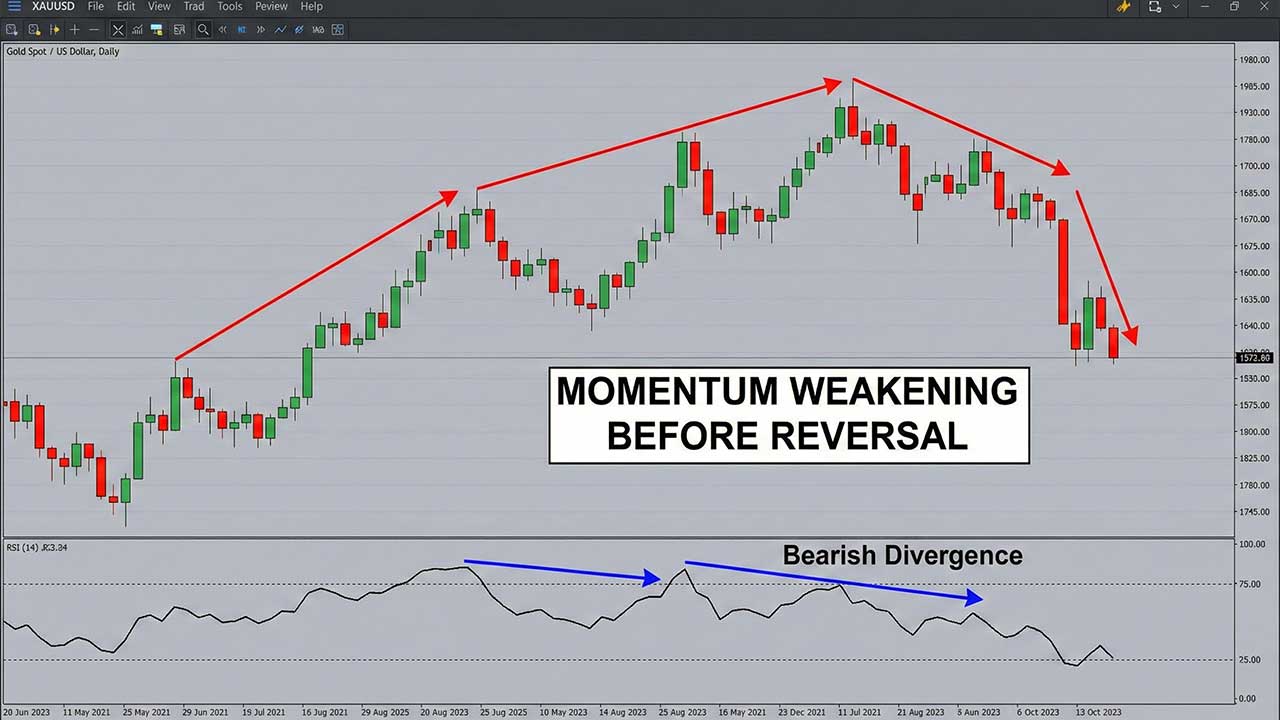
RSI: Understanding Momentum Instead of Guessing Reversals
The Relative Strength Index is widely used but often misunderstood.
In gold markets, overbought does not automatically mean sell, and oversold does not guarantee a bounce. Strong trends can keep RSI elevated for extended periods.
Experienced traders use RSI to:
Spot divergence between price and momentum
Confirm pullbacks within trends
Identify weakening pressure near key levels
When used correctly, RSI becomes one of the best indicators for trading gold because it reveals when momentum begins to fade before price visibly reverses.
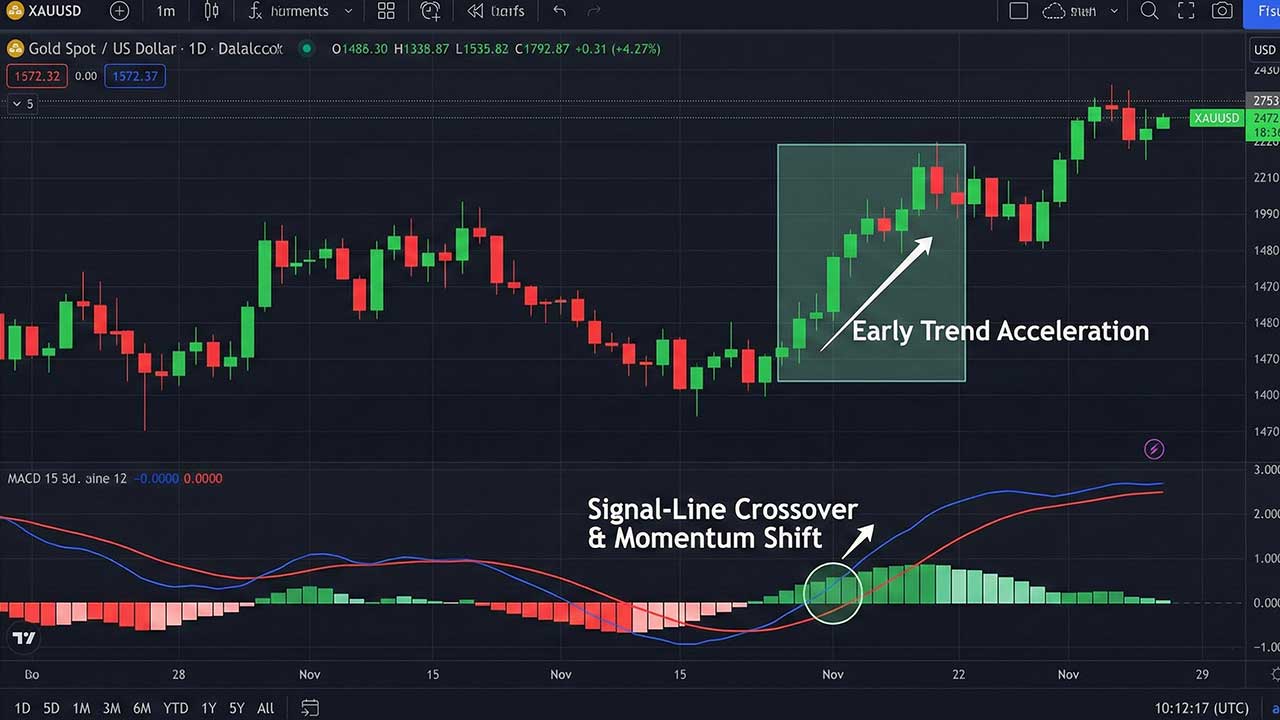
MACD: Identifying Momentum Transitions
The MACD indicator helps traders detect shifts in market momentum beneath the surface.
Gold trends often start quietly before accelerating. Changes in the MACD histogram can signal that buyers or sellers are gradually gaining control.
MACD performs best during trending environments and is frequently included in discussions about the best indicator for gold trading because it highlights continuation opportunities rather than emotional counter-trend trades.
However, during sideways markets, signals may weaken — reinforcing why no single tool should be used alone.
Bollinger Bands and Volatility Cycles
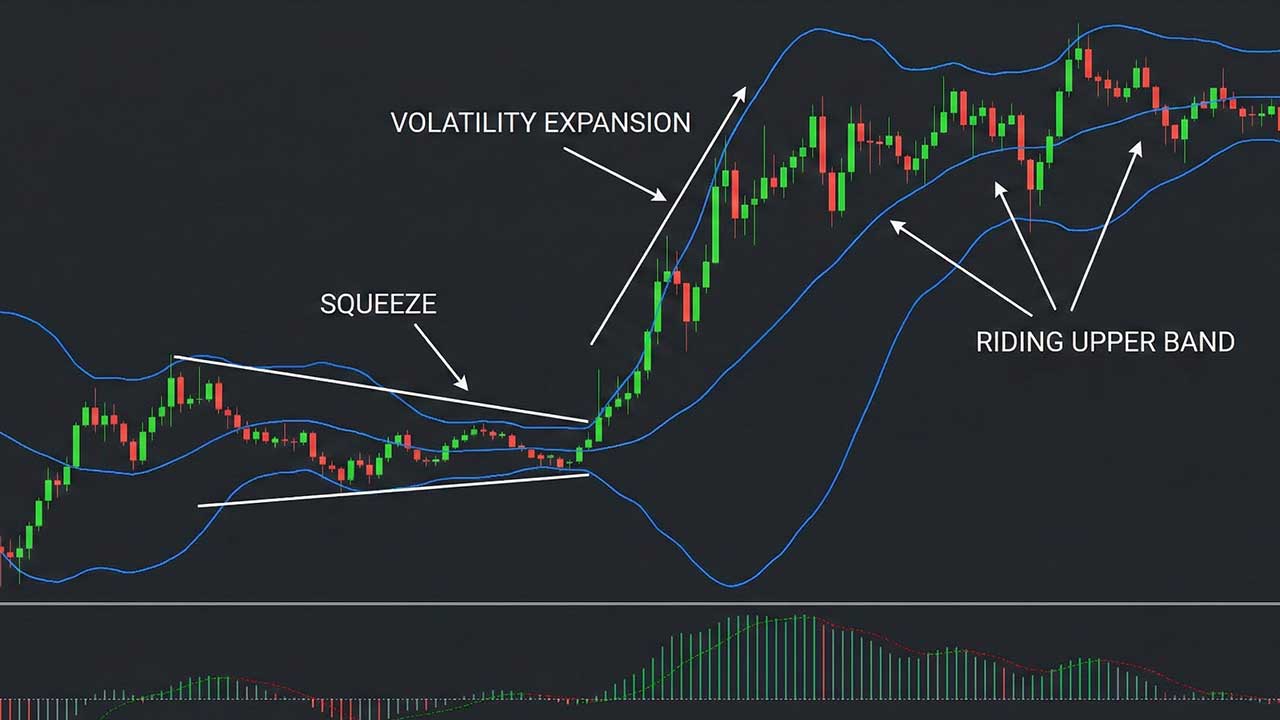
Gold moves through repeating cycles of compression and expansion. Bollinger Bands visualize these changes clearly.
When bands tighten, volatility is contracting and a breakout may be approaching. When price expands strongly beyond the bands, momentum is often increasing rather than reversing.
A common mistake is treating every band touch as a reversal signal. In reality, strong trends can push price along the outer band for extended periods.
Used properly, volatility tools rank among the best indicators for trading gold because they help traders prepare for expansion phases rather than reacting late.
Volume: The Confirmation Most Traders Ignore
Across professional trading environments, volume is considered one of the most important confirmations.
Price movement alone does not equal strength. Participation matters.
Breakout with strong volume → higher probability continuation
Breakout with weak volume → potential false move
Many traders argue that volume confirmation transforms an average setup into one aligned with institutional activity, making it a critical component when evaluating the best indicator for gold trading strategies.
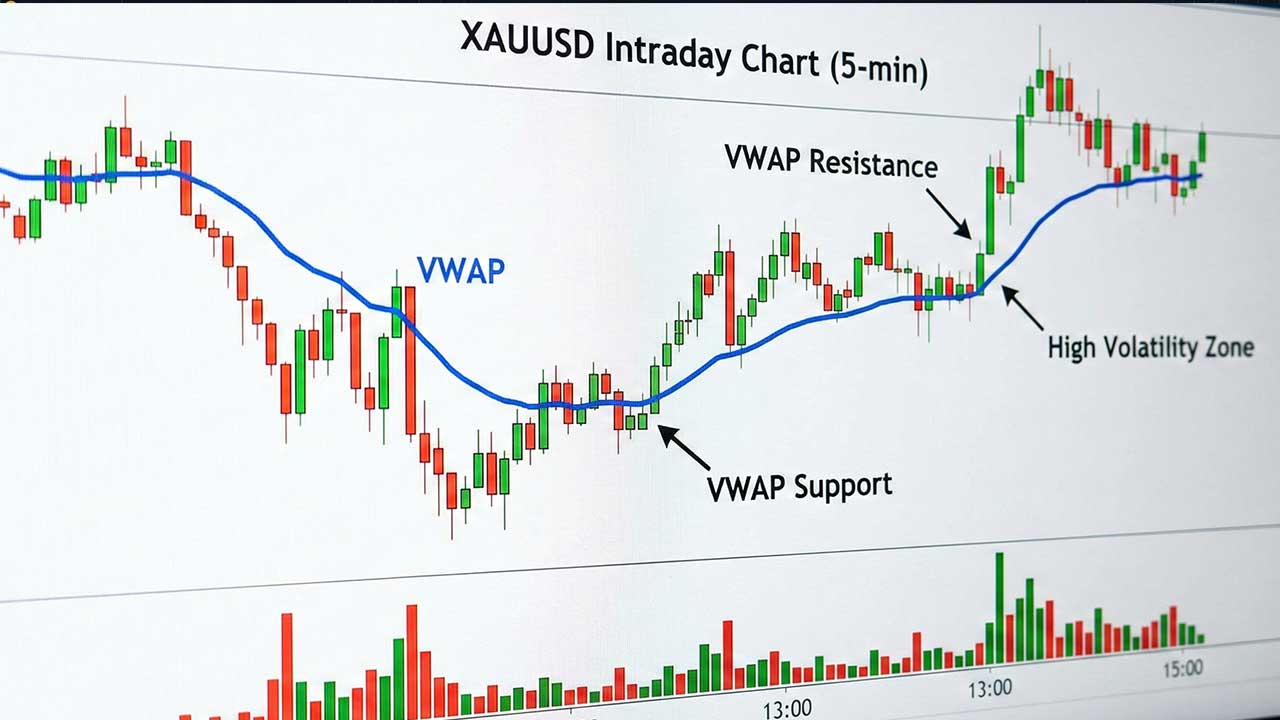
VWAP: Reading Institutional Bias
The Volume Weighted Average Price (VWAP) helps traders understand where institutional participants consider fair value during the trading session.
General interpretation:
Price above VWAP suggests bullish control
Price below VWAP signals selling pressure
Intraday traders often combine VWAP with momentum indicators to align with dominant market flow instead of fighting it during volatile sessions.
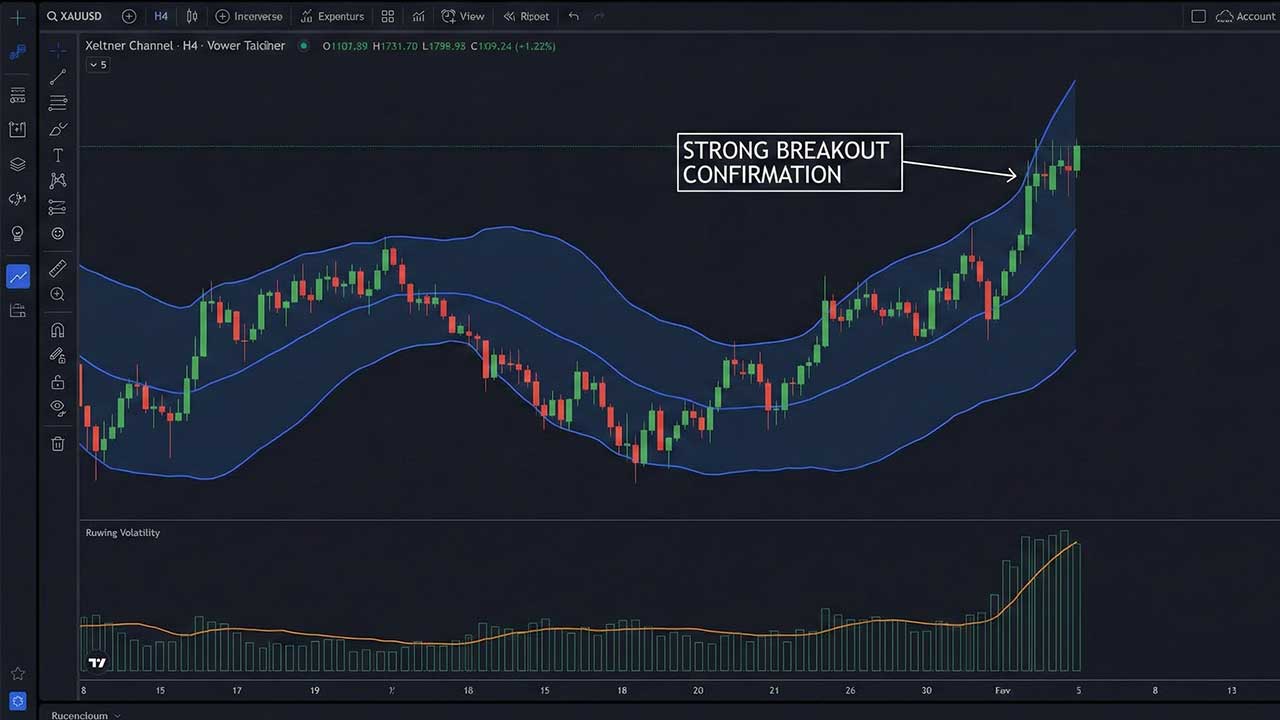
Keltner Channels and Breakout Confirmation
Keltner Channels offer a cleaner volatility framework compared to standard deviation-based indicators.
When candles close decisively outside the channel alongside increasing momentum, traders often interpret it as confirmation of a developing trend.
Because gold frequently experiences strong breakout phases, many traders include Keltner Channels among the best indicators for trading gold during momentum markets.
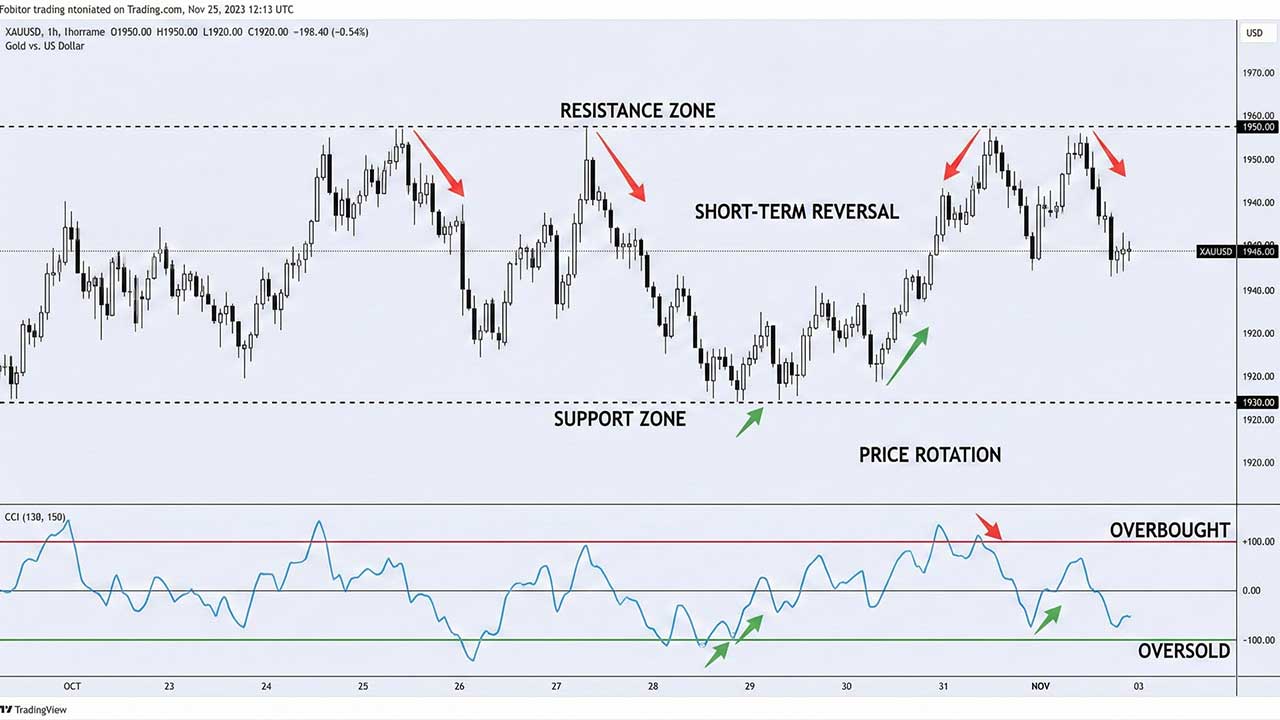
CCI: Spotting Short-Term Extremes
The Commodity Channel Index works particularly well when gold enters consolidation phases.
It helps identify temporary overextensions where price may rotate back toward equilibrium. While not ideal for long trends, it becomes valuable during ranging environments where gold repeatedly oscillates between support and resistance.
Indicator Combinations Traders Actually Use
The real answer to finding the best indicator for gold trading lies in confluence.
Trend Trading
Moving averages for direction
RSI for momentum confirmation
Breakout Trading
Bollinger or Keltner Channels
Volume validation
Intraday Volatility Trading
VWAP for bias
MACD for momentum shift
Adaptive moving averages for timing
Each tool contributes unique information instead of repeating the same signal. This layered approach works best when paired with solid risk management rules that protect capital during unpredictable gold movements.
Adjusting Gold Indicators by Trading Style
Gold behaves differently depending on timeframe.
Day Traders
Faster indicator settings
Strong reliance on VWAP and volume
Momentum-focused entries
Swing Traders
Higher timeframe moving averages
Standard RSI levels
Trend continuation strategies
Understanding this distinction helps traders choose the best indicators for trading gold based on their approach rather than copying generic setups. Traders focusing on higher‑timeframe moves often apply concepts used in swing trading strategies to align indicators with broader market structure.
Common Mistakes When Using Gold Indicators
Even the best indicator for gold trading fails when misused. Common errors include:
Adding too many indicators
Trading against the dominant trend
Misinterpreting overbought signals
Ignoring macroeconomic events
Neglecting risk management
Gold rewards disciplined structure and punishes emotional decision-making.
Execution Matters as Much as Indicators
Indicators interpret price, but execution quality determines results. During volatile periods, spreads, platform stability, and pricing accuracy can affect how reliably signals translate into real trades.
Traders therefore combine strong technical analysis with reliable execution environments to ensure indicators reflect true market conditions.
The Real Edge in Gold Trading
The strongest takeaway is clear:
The best indicator for gold trading is not a single tool — it is alignment between trend, momentum, and participation.
Moving averages define direction. RSI and MACD measure strength. Volatility tools highlight expansion. Volume confirms conviction. VWAP reveals institutional bias.
Together, these create a structured framework that helps traders navigate volatility with confidence.
Final Thoughts
Gold trading will always remain challenging because global forces constantly influence price behavior. Indicators provide structure within that uncertainty. Many traders also find that combining disciplined analysis with access to funded trading environments, such as those offered by Pipstone Capital, allows them to apply structured strategies without overexposing personal capital.
Rather than searching endlessly for one perfect signal, experienced traders build systems using the best indicators for trading gold in combination. The goal is not certainty, it is probability.
In volatile markets, consistency comes from understanding how indicators complement each other. That approach, more than any single tool, is what allows traders to survive and grow in the gold market over time.
FAQs: Gold Trading Indicators
What is the best indicator for gold trading?
There is no single best indicator. Traders typically combine moving averages, RSI, and volume to confirm trend and momentum during volatility.
Do indicators work differently on gold compared to forex pairs?
Yes. Gold reacts strongly to news and risk sentiment, so indicators must be used for confirmation rather than prediction.
Which indicators are best for trading gold intraday?
VWAP, MACD, and fast moving averages are commonly used to track momentum and institutional bias during active sessions.
Is RSI reliable for gold trading?
RSI works well when used to measure momentum or divergence, not as a simple overbought or oversold signal.
How many indicators should be used when trading gold?
Most traders use two to three complementary indicators. Adding too many usually creates conflicting signals


Best Indicator for Gold Trading: What Traders Use in Volatility
Gold has always behaved differently from most trading instruments. While currency pairs often follow structured technical flows, XAUUSD tends to move fast, react sharply to global events, and shift direction when traders least expect it. Inflation headlines, interest-rate decisions, geopolitical tension, and shifts in risk sentiment can all trigger sudden volatility.
Because of this, one question continues to dominate trader discussions:
What is the best indicator for gold trading when markets become unpredictable?
The reality is that gold rewards preparation rather than prediction. Traders who succeed in volatile environments understand how indicators work together to interpret trend strength, momentum, and participation instead of relying on a single signal.
This guide explains what professionals actually mean when they talk about the best indicator for gold trading, and why experienced traders focus on combinations rather than shortcuts.
Why Gold Trading Requires Specialized Indicators
Gold is not simply another forex pair. It acts simultaneously as a commodity, a hedge against inflation, and a global safe-haven asset. When uncertainty rises, institutional capital flows into gold rapidly, creating aggressive price expansion. During quieter periods, price may compress tightly before breaking into explosive moves.
These characteristics create:
Sudden volatility spikes
Strong directional trends followed by sharp reversals
Emotion-driven trading behavior
Because of this, many traditional strategies fail. Traders searching for the best indicator for gold trading quickly learn that slower lagging tools struggle to keep up with rapid price movement.
Instead, successful traders use indicators to confirm what price is already showing rather than trying to predict where it will go next. For newer traders, learning foundational concepts from structured forex trading tips for beginner traders can help build context before applying advanced gold indicators.
What Defines the Best Indicator for Gold Trading?
Not every indicator adapts well to XAUUSD. The best indicators for trading gold share several important traits:
They respond quickly during volatility
They clearly identify trend direction
They measure momentum strength
They help filter false breakouts
They remain reliable across timeframes
Indicators that provide overlapping information usually add confusion rather than clarity. The goal is balance — each tool should answer a different market question.
The Truth: There Is No Single Perfect Tool
Many beginners search endlessly for the best indicator for gold trading as if one setting guarantees profitable entries. Professional traders approach markets differently.
Instead of asking which indicator is best, they focus on understanding:
Is gold trending or consolidating?
Is momentum strengthening or fading?
Are institutions participating in the move?
Each indicator contributes a piece of that puzzle. When multiple signals align, probability improves. Traders who want to go deeper often study how indicators fit inside a structured gold trading strategy for XAU/USD to understand when different tools perform best.
Moving Averages: The Backbone of Gold Analysis
Moving averages remain among the best indicators for trading gold because they simplify market direction.
Popular setups include:
20 and 50 EMA for short-term momentum
50 and 200 SMA for long-term trend confirmation
Gold frequently reacts to higher-timeframe averages as dynamic support or resistance. Rather than relying solely on crossover signals, traders observe how price behaves around these levels.
Adaptive moving averages are especially useful during volatile conditions because they adjust sensitivity as market speed changes. This adaptability is one reason many traders consider them part of the best indicator for gold trading framework. Many traders combine these signals with clearly defined stop loss and take profit levels to manage volatility more effectively.
RSI: Understanding Momentum Instead of Guessing Reversals
The Relative Strength Index is widely used but often misunderstood.
In gold markets, overbought does not automatically mean sell, and oversold does not guarantee a bounce. Strong trends can keep RSI elevated for extended periods.
Experienced traders use RSI to:
Spot divergence between price and momentum
Confirm pullbacks within trends
Identify weakening pressure near key levels
When used correctly, RSI becomes one of the best indicators for trading gold because it reveals when momentum begins to fade before price visibly reverses.
MACD: Identifying Momentum Transitions
The MACD indicator helps traders detect shifts in market momentum beneath the surface.
Gold trends often start quietly before accelerating. Changes in the MACD histogram can signal that buyers or sellers are gradually gaining control.
MACD performs best during trending environments and is frequently included in discussions about the best indicator for gold trading because it highlights continuation opportunities rather than emotional counter-trend trades.
However, during sideways markets, signals may weaken — reinforcing why no single tool should be used alone.
Bollinger Bands and Volatility Cycles
Gold moves through repeating cycles of compression and expansion. Bollinger Bands visualize these changes clearly.
When bands tighten, volatility is contracting and a breakout may be approaching. When price expands strongly beyond the bands, momentum is often increasing rather than reversing.
A common mistake is treating every band touch as a reversal signal. In reality, strong trends can push price along the outer band for extended periods.
Used properly, volatility tools rank among the best indicators for trading gold because they help traders prepare for expansion phases rather than reacting late.
Volume: The Confirmation Most Traders Ignore
Across professional trading environments, volume is considered one of the most important confirmations.
Price movement alone does not equal strength. Participation matters.
Breakout with strong volume → higher probability continuation
Breakout with weak volume → potential false move
Many traders argue that volume confirmation transforms an average setup into one aligned with institutional activity, making it a critical component when evaluating the best indicator for gold trading strategies.
VWAP: Reading Institutional Bias
The Volume Weighted Average Price (VWAP) helps traders understand where institutional participants consider fair value during the trading session.
General interpretation:
Price above VWAP suggests bullish control
Price below VWAP signals selling pressure
Intraday traders often combine VWAP with momentum indicators to align with dominant market flow instead of fighting it during volatile sessions.
Keltner Channels and Breakout Confirmation
Keltner Channels offer a cleaner volatility framework compared to standard deviation-based indicators.
When candles close decisively outside the channel alongside increasing momentum, traders often interpret it as confirmation of a developing trend.
Because gold frequently experiences strong breakout phases, many traders include Keltner Channels among the best indicators for trading gold during momentum markets.
CCI: Spotting Short-Term Extremes
The Commodity Channel Index works particularly well when gold enters consolidation phases.
It helps identify temporary overextensions where price may rotate back toward equilibrium. While not ideal for long trends, it becomes valuable during ranging environments where gold repeatedly oscillates between support and resistance.
Indicator Combinations Traders Actually Use
The real answer to finding the best indicator for gold trading lies in confluence.
Trend Trading
Moving averages for direction
RSI for momentum confirmation
Breakout Trading
Bollinger or Keltner Channels
Volume validation
Intraday Volatility Trading
VWAP for bias
MACD for momentum shift
Adaptive moving averages for timing
Each tool contributes unique information instead of repeating the same signal. This layered approach works best when paired with solid risk management rules that protect capital during unpredictable gold movements.
Adjusting Gold Indicators by Trading Style
Gold behaves differently depending on timeframe.
Day Traders
Faster indicator settings
Strong reliance on VWAP and volume
Momentum-focused entries
Swing Traders
Higher timeframe moving averages
Standard RSI levels
Trend continuation strategies
Understanding this distinction helps traders choose the best indicators for trading gold based on their approach rather than copying generic setups. Traders focusing on higher‑timeframe moves often apply concepts used in swing trading strategies to align indicators with broader market structure.
Common Mistakes When Using Gold Indicators
Even the best indicator for gold trading fails when misused. Common errors include:
Adding too many indicators
Trading against the dominant trend
Misinterpreting overbought signals
Ignoring macroeconomic events
Neglecting risk management
Gold rewards disciplined structure and punishes emotional decision-making.
Execution Matters as Much as Indicators
Indicators interpret price, but execution quality determines results. During volatile periods, spreads, platform stability, and pricing accuracy can affect how reliably signals translate into real trades.
Traders therefore combine strong technical analysis with reliable execution environments to ensure indicators reflect true market conditions.
The Real Edge in Gold Trading
The strongest takeaway is clear:
The best indicator for gold trading is not a single tool — it is alignment between trend, momentum, and participation.
Moving averages define direction. RSI and MACD measure strength. Volatility tools highlight expansion. Volume confirms conviction. VWAP reveals institutional bias.
Together, these create a structured framework that helps traders navigate volatility with confidence.
Final Thoughts
Gold trading will always remain challenging because global forces constantly influence price behavior. Indicators provide structure within that uncertainty. Many traders also find that combining disciplined analysis with access to funded trading environments, such as those offered by Pipstone Capital, allows them to apply structured strategies without overexposing personal capital.
Rather than searching endlessly for one perfect signal, experienced traders build systems using the best indicators for trading gold in combination. The goal is not certainty, it is probability.
In volatile markets, consistency comes from understanding how indicators complement each other. That approach, more than any single tool, is what allows traders to survive and grow in the gold market over time.
FAQs: Gold Trading Indicators
What is the best indicator for gold trading?
There is no single best indicator. Traders typically combine moving averages, RSI, and volume to confirm trend and momentum during volatility.
Do indicators work differently on gold compared to forex pairs?
Yes. Gold reacts strongly to news and risk sentiment, so indicators must be used for confirmation rather than prediction.
Which indicators are best for trading gold intraday?
VWAP, MACD, and fast moving averages are commonly used to track momentum and institutional bias during active sessions.
Is RSI reliable for gold trading?
RSI works well when used to measure momentum or divergence, not as a simple overbought or oversold signal.
How many indicators should be used when trading gold?
Most traders use two to three complementary indicators. Adding too many usually creates conflicting signals
