


XAU/USD Price Action Strategy: How to Trade Gold Without Indicators

Gold traders often fill their charts with moving averages, RSI, MACD, and other tools.
That can help, but indicators are not required to trade XAU/USD.
Price itself already shows useful information.
It shows where buyers step in, where sellers take control, and where momentum starts to change. A price action gold trading strategy focuses on those signals instead of relying on indicators.
The goal is not to predict every move.
You want to identify important areas, wait for price to react, and enter when the market confirms your idea.
This guide explains how to trade gold using price action, market structure, support and resistance, candlesticks, and breakouts.
What Is a Price Action Gold Trading Strategy?
A Price Action Gold Trading Strategy uses the movement of XAU/USD itself to make trading decisions.
Instead of waiting for an indicator signal, traders study:
Swing highs and swing lows
Support and resistance levels
Candlestick patterns
Breakouts and false breakouts
Trend structure
Rejections from key prices
Previous session highs and lows
The chart can remain very simple.
You may only need candlesticks and several marked price levels.
Price action traders believe the chart shows the balance between buyers and sellers. When that balance changes, price often leaves clues.
The challenge is learning which clues matter.
Not every candle deserves a trade. The location and market structure matter more than one pattern alone.
Price action is one approach traders can use within a broader XAUUSD trading strategy that also considers risk and market conditions.
Why Price Action Works Well With XAU/USD
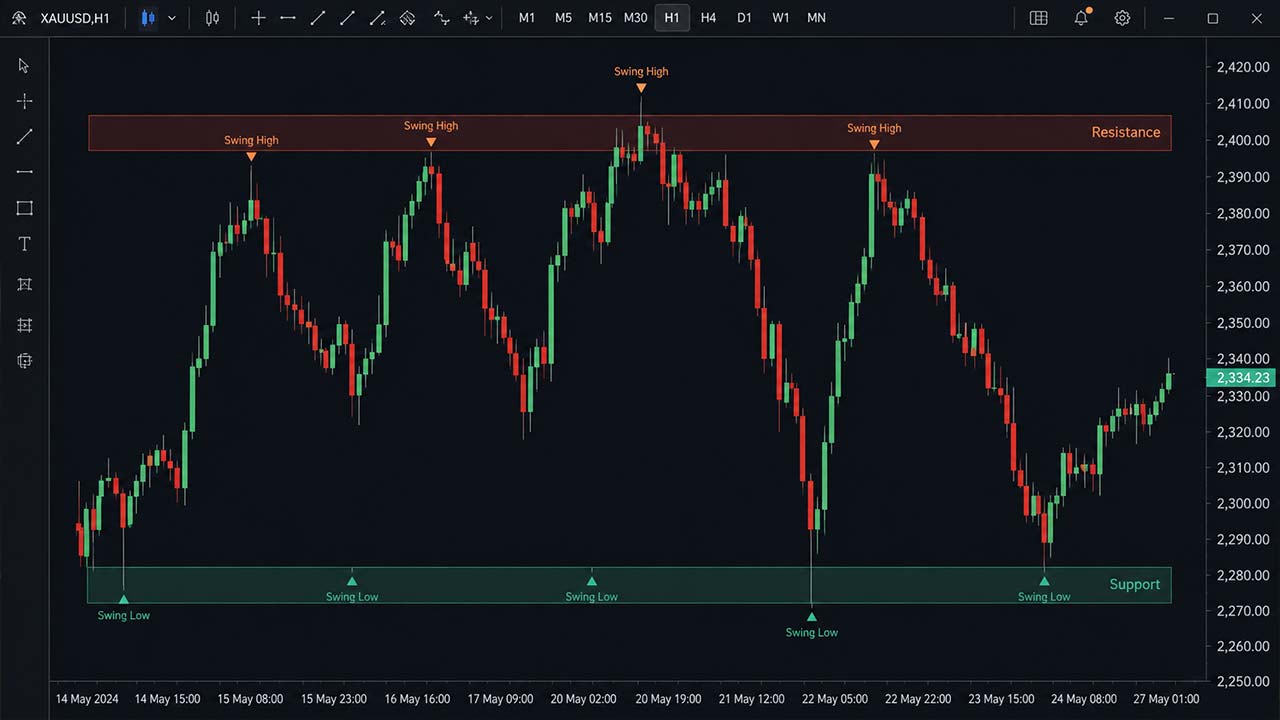
Gold often reacts strongly around clear technical levels.
A previous daily high can become resistance. A broken resistance level may later act as support. Strong rejection candles can also form around major price zones.
XAU/USD is also known for sharp intraday moves.
That creates opportunities, but it can also punish weak entries.
Price action helps traders focus on what gold is doing right now.
Instead of thinking, "RSI says gold is overbought," you can ask better questions:
Is gold still making higher highs?
Did buyers defend support?
Was resistance actually broken?
Did the breakout candle close above the level?
Has price returned to test the breakout?
Are sellers rejecting a major high?
These questions are based on actual market behavior.
Step 1: Start With Gold Market Structure
Market structure should come before any entry pattern.
You first need to know whether gold is trending higher, trending lower, or moving sideways.
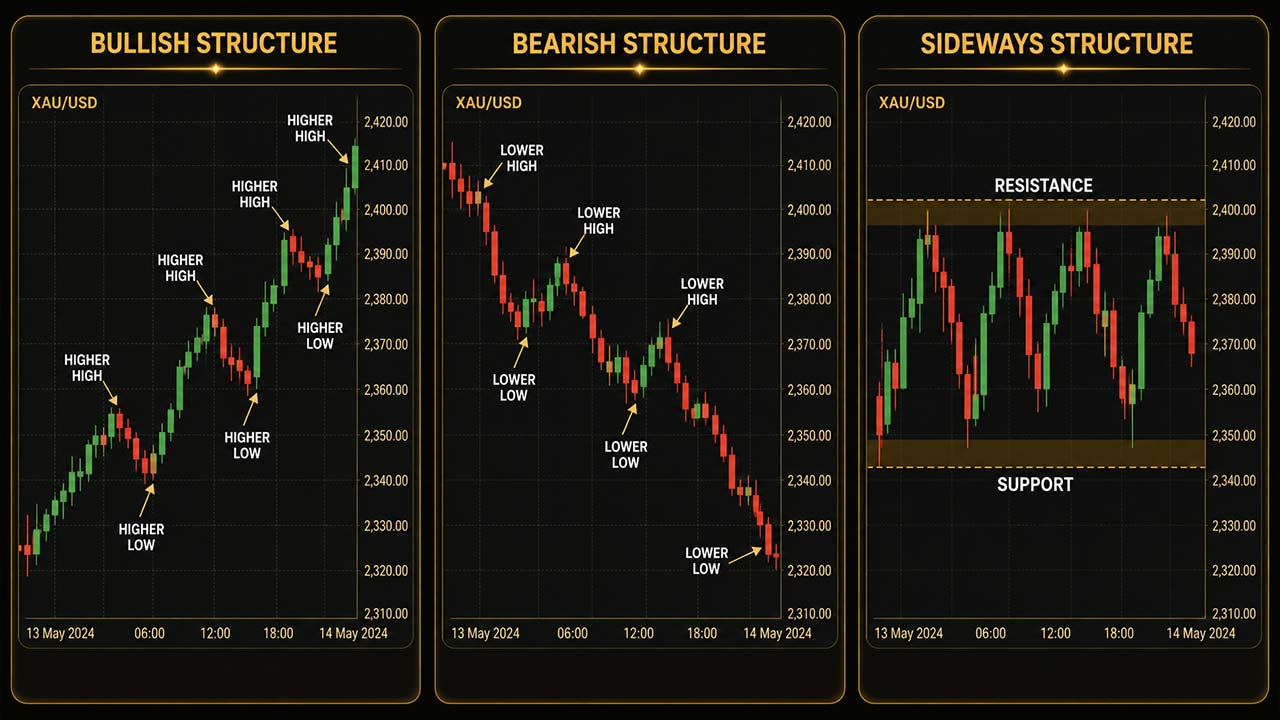
Bullish structure
A bullish market usually forms:
Higher high → Higher low → Higher high → Higher low
Buyers keep pushing gold above previous highs.
Pullbacks also stop above earlier swing lows.
In this market, buying pullbacks often makes more sense than trying to short every rally.
Bearish structure
A bearish market usually forms:
Lower low → Lower high → Lower low → Lower high
Sellers control the larger move.
Rallies may offer possible short setups when price reaches resistance.
Sideways structure
Sometimes XAU/USD has no clear direction.
Price repeatedly moves between support and resistance.
Trying to trade every small movement inside this range can create poor entries.
Instead, many price action traders wait near the range boundaries.
Step 2: Mark Support and Resistance
Support and resistance are central to almost every price action gold trading strategy.
Support is an area where buying pressure has appeared before.
Resistance is an area where sellers previously became stronger.
Avoid drawing dozens of lines.
Focus on levels that price has clearly respected.
Useful XAU/USD levels can include:
Previous daily highs and lows
Strong swing highs and lows
Weekly highs and lows
Previous breakout levels
Areas with several strong price reactions
Think of support and resistance as zones rather than exact prices.
Gold can briefly move through a level before reversing.
That does not always mean the level failed.
For example, assume gold repeatedly rejects the $3,350 area.
Price later rises to $3,352 before dropping sharply.
Treating $3,350 as one exact line could make the move look like a breakout. Viewing 3,348-3,353 as a zone gives more context.
Price action signals often become more meaningful near key levels identified through a gold support and resistance strategy.
Step 3: Wait for Price Action Confirmation
Finding a good level is only the first step.
You still need a reason to enter.
Price action confirmation helps show whether buyers or sellers are actually reacting to that area.
Several common signals can help.
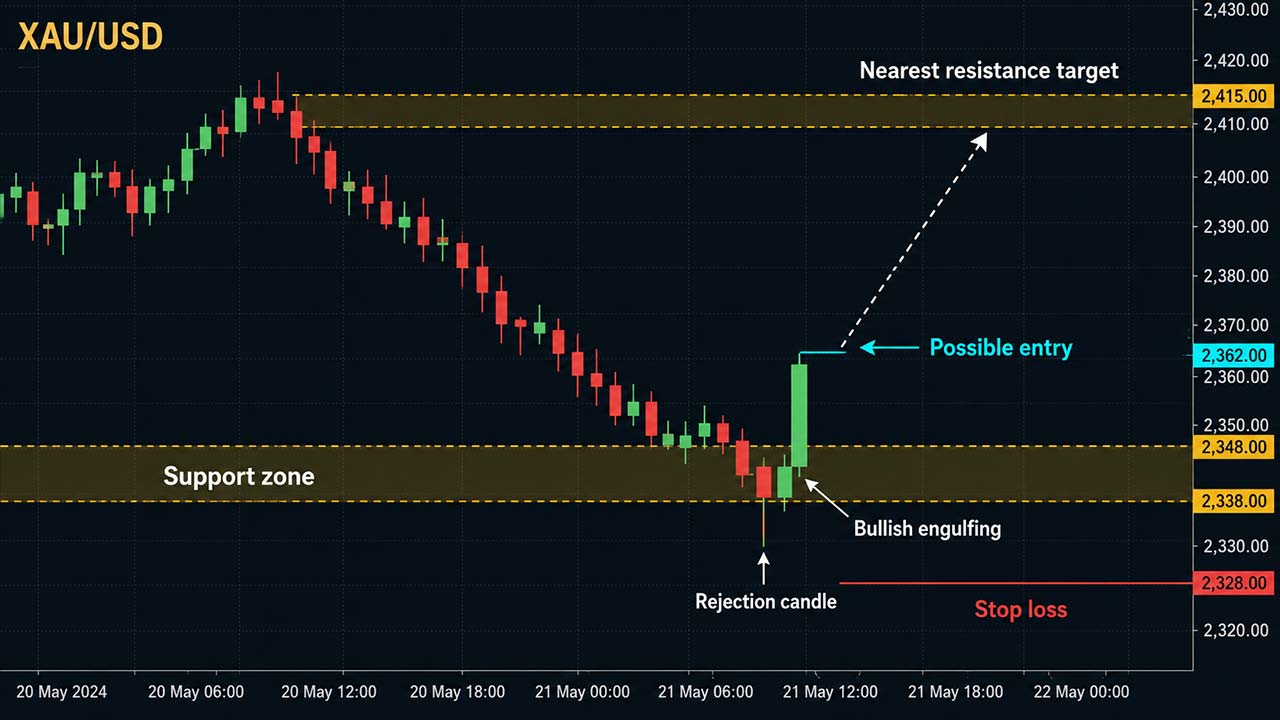
Pin bar rejection
A pin bar has a long wick and smaller body.
A long lower wick near support can show buyers rejecting lower prices.
A long upper wick near resistance can show sellers rejecting higher prices.
But location matters.
A random pin bar in the middle of a range means far less.

Engulfing candle
A bullish engulfing pattern forms when a strong bullish candle takes over the previous bearish candle.
A bearish engulfing pattern shows the opposite.
These patterns can become more useful when they appear at important XAU/USD levels.
Strong breakout candle
Sometimes the cleanest signal is simply a strong candle closing through support or resistance.
The candle should close clearly beyond the zone.
A wick above resistance followed by a close below it is weaker confirmation.
That can even become a false breakout signal.
A Simple Price Action XAUUSD Strategy
You can turn these ideas into a basic trading process.
1. Find the trend
Look at the larger chart first.
A one-hour or four-hour chart can help show the main direction.
If gold keeps forming higher highs and higher lows, focus more on buying opportunities.
If structure is bearish, focus more on potential shorts.
2. Mark an important level
Find a support or resistance area where price has reacted before.
Avoid levels with little history.
3. Wait for gold to reach the area
Do not chase price because the market is moving quickly.
Let XAU/USD reach your planned zone.
4. Look for confirmation
You might wait for:
A rejection candle
An engulfing candle
A false breakout
A break and retest
A market structure shift
5. Place the stop beyond the setup
Your stop should sit where the trade idea becomes invalid.
For a long trade from support, that may be below the recent swing low.
For a short trade, it could be above the recent high.
6. Choose your target before entering
Potential targets include:
Previous swing highs
Previous swing lows
Major support
Major resistance
Range boundaries
The possible reward should justify the risk.
Taking a trade with a tiny target and large stop rarely makes sense.
Break and Retest Strategy for Gold
Break-and-retest setups are common in XAU/USD price action trading.
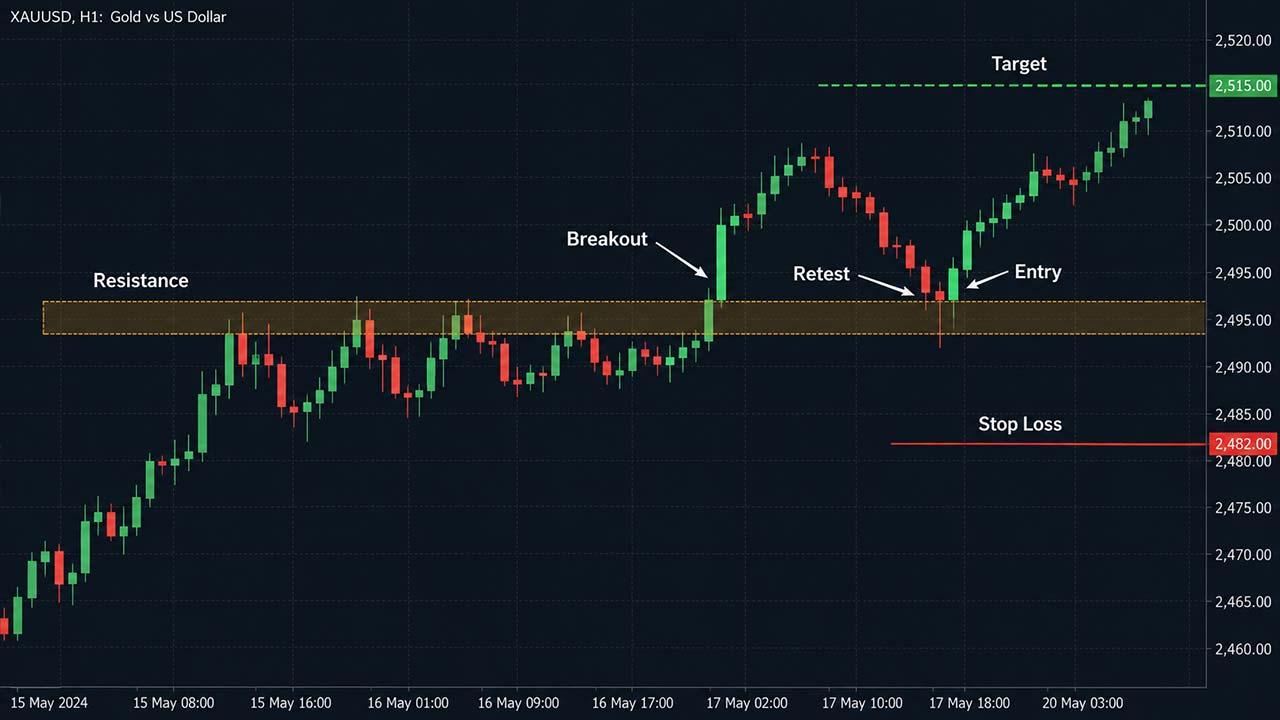
Assume gold has been struggling below resistance.
Price eventually breaks through the area with a strong bullish candle.
Instead of buying immediately, you wait.
Gold then pulls back toward the old resistance.
If buyers defend the area, old resistance may become new support.
A possible process looks like this:
Identify clear resistance.
Wait for a candle to close above resistance.
Avoid chasing the breakout.
Wait for price to return toward the broken level.
Look for bullish rejection.
Enter after confirmation.
Place the stop below the retest structure.
Target the next major resistance area.
This approach can help avoid poor entries after large breakout candles.
It also gives you a clear point where the setup becomes invalid.
False Breakouts Can Create Strong Gold Setups
Gold can move through a major level and reverse quickly.
This is often called a false breakout.
Suppose resistance sits near $3,400.
Gold pushes above $3,400 and reaches $3,405. Traders may assume a breakout has started.
Price then drops sharply and closes back below resistance.
That changes the picture.
Buyers who entered above resistance may become trapped.
If selling pressure continues, the false breakout can become a possible short setup.
The same can happen below support.
Gold may briefly fall below support before buyers push it back above the level.
The key is waiting for confirmation instead of reacting to the first breakout wick.
Best Time to Use Price Action on Gold
Price action can be used across different trading sessions.
Still, active periods often produce cleaner movements.
Gold commonly sees stronger activity during the London session and the overlap between London and New York.
The New York session is also important because many major US economic reports are released during those hours.
Events that can move XAU/USD include:
US CPI data
Non-Farm Payrolls
Federal Reserve decisions
US interest rate news
Major geopolitical events
Price action can become less reliable around sudden news spikes.
A technically perfect support level can break quickly when major data surprises the market.
Traders should always know when high-impact news is scheduled.
Price Action Entry Example
Imagine XAU/USD is in an uptrend on the four-hour chart.
Gold forms the following structure:
Higher high → Higher low → Higher high
You mark the previous higher low as an important support zone.
Gold later pulls back into that area.
Instead of buying immediately, you wait.
Price briefly moves below support but quickly recovers. A long lower wick forms.
The next candle closes strongly bullish.
You now have several factors supporting the trade:
Bullish market structure
Established support
Rejection of lower prices
Bullish candle confirmation
A clear invalidation point
A stop could sit below the rejected swing low.
The previous high could become the first potential target.
That is a complete price action setup.
No indicator is required.

Common Price Action Gold Trading Mistakes
Price action looks simple, but simple does not mean easy.
Watch for these common mistakes.
Drawing too many levels
A chart covered with support and resistance lines becomes difficult to read.
Mark only levels that have clear market importance.
Trading every candlestick pattern
A pin bar alone is not a trading strategy.
A strong level, trend, and market structure give the candle context.
Entering before confirmation
Gold can move quickly around support and resistance.
Buying because price simply touched support can lead to repeated losses.
Wait to see how price reacts.
Ignoring higher timeframes
A bullish five-minute setup may be forming directly below four-hour resistance.
Always check the larger market structure first.
Using stops that are too tight
Gold can produce large wicks.
A very tight stop may be hit even when the larger trading idea remains valid.
Your stop should reflect the structure of the setup.
Risking too much
No price action setup works every time.
Even strong-looking patterns fail.
Risk control matters more than finding the perfect candlestick.
Can You Really Trade Gold Without Indicators?
Yes.
Indicators are optional tools, not requirements.
Most indicators also use past price data to create their signals.
Price action removes that extra layer.
You study the original information directly from the chart.
That does not automatically make price action better.
Some traders prefer indicators because they create clearer rules.
Others prefer clean charts and direct price analysis.
Both approaches can work when used with proper risk control.
The best method is the one you can follow without constantly changing your rules.
How to Improve Your Price Action Gold Trading
Consistency comes from building a repeatable process.
Before entering XAU/USD, check:
What is the higher-timeframe trend?
Where is the nearest major support?
Where is the nearest resistance?
Is price currently at an important area?
Has the market confirmed the setup?
Where does the trade become invalid?
What is the possible reward compared with the risk?
Is major economic news approaching?
If you cannot answer those questions, the trade may not be ready.
Waiting is part of trading.
You do not need a position every time gold starts moving.
Final Thoughts
A price action gold trading strategy does not need a complicated chart.
Market structure, support, resistance, breakouts, and candle reactions can provide enough information for many setups.
Start with the larger trend.
Mark the levels that matter.
Then wait for XAU/USD to reach those areas and show how buyers or sellers respond.
Avoid treating one candle as a guaranteed signal. The strongest setups usually combine structure, location, confirmation, and sensible risk.
For traders using Pipstone Capital accounts, this approach can also help create more structured trade plans. Pipstone Capital offers MT5 and cTrader access, no time limit on eligible challenges, and reward splits that can reach 100% on qualifying accounts.
The goal should not be finding more trades.
It should be finding better reasons to take them.
FAQs: Price Action XAU/USD Trading Strategy
What is the best Price Action Gold Trading Strategy?
One simple approach combines market structure, support and resistance, and candle confirmation. Wait for XAU/USD to reach an important level before looking for an entry.
Can I trade XAU/USD without indicators?
Yes. Traders can use market structure, candlesticks, support, resistance, breakouts, and price reactions without technical indicators.
Which timeframe is best for gold price action?
The one-hour and four-hour charts are useful for identifying structure and important levels. Lower timeframes can then help refine entries.
What is the best price action signal for gold?
There is no single best signal. Rejections, engulfing candles, break-and-retest setups, and false breakouts become stronger when they form at important levels.
Does price action work during gold news events?
Price action can still provide context, but major news can cause sudden volatility and slippage. Many traders reduce risk or wait until the first news spike settles.



XAU/USD Price Action Strategy: How to Trade Gold Without Indicators
Gold traders often fill their charts with moving averages, RSI, MACD, and other tools.
That can help, but indicators are not required to trade XAU/USD.
Price itself already shows useful information.
It shows where buyers step in, where sellers take control, and where momentum starts to change. A price action gold trading strategy focuses on those signals instead of relying on indicators.
The goal is not to predict every move.
You want to identify important areas, wait for price to react, and enter when the market confirms your idea.
This guide explains how to trade gold using price action, market structure, support and resistance, candlesticks, and breakouts.
What Is a Price Action Gold Trading Strategy?
A Price Action Gold Trading Strategy uses the movement of XAU/USD itself to make trading decisions.
Instead of waiting for an indicator signal, traders study:
Swing highs and swing lows
Support and resistance levels
Candlestick patterns
Breakouts and false breakouts
Trend structure
Rejections from key prices
Previous session highs and lows
The chart can remain very simple.
You may only need candlesticks and several marked price levels.
Price action traders believe the chart shows the balance between buyers and sellers. When that balance changes, price often leaves clues.
The challenge is learning which clues matter.
Not every candle deserves a trade. The location and market structure matter more than one pattern alone.
Price action is one approach traders can use within a broader XAUUSD trading strategy that also considers risk and market conditions.
Why Price Action Works Well With XAU/USD
Gold often reacts strongly around clear technical levels.
A previous daily high can become resistance. A broken resistance level may later act as support. Strong rejection candles can also form around major price zones.
XAU/USD is also known for sharp intraday moves.
That creates opportunities, but it can also punish weak entries.
Price action helps traders focus on what gold is doing right now.
Instead of thinking, "RSI says gold is overbought," you can ask better questions:
Is gold still making higher highs?
Did buyers defend support?
Was resistance actually broken?
Did the breakout candle close above the level?
Has price returned to test the breakout?
Are sellers rejecting a major high?
These questions are based on actual market behavior.
Step 1: Start With Gold Market Structure
Market structure should come before any entry pattern.
You first need to know whether gold is trending higher, trending lower, or moving sideways.
Bullish structure
A bullish market usually forms:
Higher high → Higher low → Higher high → Higher low
Buyers keep pushing gold above previous highs.
Pullbacks also stop above earlier swing lows.
In this market, buying pullbacks often makes more sense than trying to short every rally.
Bearish structure
A bearish market usually forms:
Lower low → Lower high → Lower low → Lower high
Sellers control the larger move.
Rallies may offer possible short setups when price reaches resistance.
Sideways structure
Sometimes XAU/USD has no clear direction.
Price repeatedly moves between support and resistance.
Trying to trade every small movement inside this range can create poor entries.
Instead, many price action traders wait near the range boundaries.
Step 2: Mark Support and Resistance
Support and resistance are central to almost every price action gold trading strategy.
Support is an area where buying pressure has appeared before.
Resistance is an area where sellers previously became stronger.
Avoid drawing dozens of lines.
Focus on levels that price has clearly respected.
Useful XAU/USD levels can include:
Previous daily highs and lows
Strong swing highs and lows
Weekly highs and lows
Previous breakout levels
Areas with several strong price reactions
Think of support and resistance as zones rather than exact prices.
Gold can briefly move through a level before reversing.
That does not always mean the level failed.
For example, assume gold repeatedly rejects the $3,350 area.
Price later rises to $3,352 before dropping sharply.
Treating $3,350 as one exact line could make the move look like a breakout. Viewing 3,348-3,353 as a zone gives more context.
Price action signals often become more meaningful near key levels identified through a gold support and resistance strategy.
Step 3: Wait for Price Action Confirmation
Finding a good level is only the first step.
You still need a reason to enter.
Price action confirmation helps show whether buyers or sellers are actually reacting to that area.
Several common signals can help.
Pin bar rejection
A pin bar has a long wick and smaller body.
A long lower wick near support can show buyers rejecting lower prices.
A long upper wick near resistance can show sellers rejecting higher prices.
But location matters.
A random pin bar in the middle of a range means far less.
Engulfing candle
A bullish engulfing pattern forms when a strong bullish candle takes over the previous bearish candle.
A bearish engulfing pattern shows the opposite.
These patterns can become more useful when they appear at important XAU/USD levels.
Strong breakout candle
Sometimes the cleanest signal is simply a strong candle closing through support or resistance.
The candle should close clearly beyond the zone.
A wick above resistance followed by a close below it is weaker confirmation.
That can even become a false breakout signal.
A Simple Price Action XAUUSD Strategy
You can turn these ideas into a basic trading process.
1. Find the trend
Look at the larger chart first.
A one-hour or four-hour chart can help show the main direction.
If gold keeps forming higher highs and higher lows, focus more on buying opportunities.
If structure is bearish, focus more on potential shorts.
2. Mark an important level
Find a support or resistance area where price has reacted before.
Avoid levels with little history.
3. Wait for gold to reach the area
Do not chase price because the market is moving quickly.
Let XAU/USD reach your planned zone.
4. Look for confirmation
You might wait for:
A rejection candle
An engulfing candle
A false breakout
A break and retest
A market structure shift
5. Place the stop beyond the setup
Your stop should sit where the trade idea becomes invalid.
For a long trade from support, that may be below the recent swing low.
For a short trade, it could be above the recent high.
6. Choose your target before entering
Potential targets include:
Previous swing highs
Previous swing lows
Major support
Major resistance
Range boundaries
The possible reward should justify the risk.
Taking a trade with a tiny target and large stop rarely makes sense.
Break and Retest Strategy for Gold
Break-and-retest setups are common in XAU/USD price action trading.
Assume gold has been struggling below resistance.
Price eventually breaks through the area with a strong bullish candle.
Instead of buying immediately, you wait.
Gold then pulls back toward the old resistance.
If buyers defend the area, old resistance may become new support.
A possible process looks like this:
Identify clear resistance.
Wait for a candle to close above resistance.
Avoid chasing the breakout.
Wait for price to return toward the broken level.
Look for bullish rejection.
Enter after confirmation.
Place the stop below the retest structure.
Target the next major resistance area.
This approach can help avoid poor entries after large breakout candles.
It also gives you a clear point where the setup becomes invalid.
False Breakouts Can Create Strong Gold Setups
Gold can move through a major level and reverse quickly.
This is often called a false breakout.
Suppose resistance sits near $3,400.
Gold pushes above $3,400 and reaches $3,405. Traders may assume a breakout has started.
Price then drops sharply and closes back below resistance.
That changes the picture.
Buyers who entered above resistance may become trapped.
If selling pressure continues, the false breakout can become a possible short setup.
The same can happen below support.
Gold may briefly fall below support before buyers push it back above the level.
The key is waiting for confirmation instead of reacting to the first breakout wick.
Best Time to Use Price Action on Gold
Price action can be used across different trading sessions.
Still, active periods often produce cleaner movements.
Gold commonly sees stronger activity during the London session and the overlap between London and New York.
The New York session is also important because many major US economic reports are released during those hours.
Events that can move XAU/USD include:
US CPI data
Non-Farm Payrolls
Federal Reserve decisions
US interest rate news
Major geopolitical events
Price action can become less reliable around sudden news spikes.
A technically perfect support level can break quickly when major data surprises the market.
Traders should always know when high-impact news is scheduled.
Price Action Entry Example
Imagine XAU/USD is in an uptrend on the four-hour chart.
Gold forms the following structure:
Higher high → Higher low → Higher high
You mark the previous higher low as an important support zone.
Gold later pulls back into that area.
Instead of buying immediately, you wait.
Price briefly moves below support but quickly recovers. A long lower wick forms.
The next candle closes strongly bullish.
You now have several factors supporting the trade:
Bullish market structure
Established support
Rejection of lower prices
Bullish candle confirmation
A clear invalidation point
A stop could sit below the rejected swing low.
The previous high could become the first potential target.
That is a complete price action setup.
No indicator is required.
Common Price Action Gold Trading Mistakes
Price action looks simple, but simple does not mean easy.
Watch for these common mistakes.
Drawing too many levels
A chart covered with support and resistance lines becomes difficult to read.
Mark only levels that have clear market importance.
Trading every candlestick pattern
A pin bar alone is not a trading strategy.
A strong level, trend, and market structure give the candle context.
Entering before confirmation
Gold can move quickly around support and resistance.
Buying because price simply touched support can lead to repeated losses.
Wait to see how price reacts.
Ignoring higher timeframes
A bullish five-minute setup may be forming directly below four-hour resistance.
Always check the larger market structure first.
Using stops that are too tight
Gold can produce large wicks.
A very tight stop may be hit even when the larger trading idea remains valid.
Your stop should reflect the structure of the setup.
Risking too much
No price action setup works every time.
Even strong-looking patterns fail.
Risk control matters more than finding the perfect candlestick.
Can You Really Trade Gold Without Indicators?
Yes.
Indicators are optional tools, not requirements.
Most indicators also use past price data to create their signals.
Price action removes that extra layer.
You study the original information directly from the chart.
That does not automatically make price action better.
Some traders prefer indicators because they create clearer rules.
Others prefer clean charts and direct price analysis.
Both approaches can work when used with proper risk control.
The best method is the one you can follow without constantly changing your rules.
How to Improve Your Price Action Gold Trading
Consistency comes from building a repeatable process.
Before entering XAU/USD, check:
What is the higher-timeframe trend?
Where is the nearest major support?
Where is the nearest resistance?
Is price currently at an important area?
Has the market confirmed the setup?
Where does the trade become invalid?
What is the possible reward compared with the risk?
Is major economic news approaching?
If you cannot answer those questions, the trade may not be ready.
Waiting is part of trading.
You do not need a position every time gold starts moving.
Final Thoughts
A price action gold trading strategy does not need a complicated chart.
Market structure, support, resistance, breakouts, and candle reactions can provide enough information for many setups.
Start with the larger trend.
Mark the levels that matter.
Then wait for XAU/USD to reach those areas and show how buyers or sellers respond.
Avoid treating one candle as a guaranteed signal. The strongest setups usually combine structure, location, confirmation, and sensible risk.
For traders using Pipstone Capital accounts, this approach can also help create more structured trade plans. Pipstone Capital offers MT5 and cTrader access, no time limit on eligible challenges, and reward splits that can reach 100% on qualifying accounts.
The goal should not be finding more trades.
It should be finding better reasons to take them.
FAQs: Price Action XAU/USD Trading Strategy
What is the best Price Action Gold Trading Strategy?
One simple approach combines market structure, support and resistance, and candle confirmation. Wait for XAU/USD to reach an important level before looking for an entry.
Can I trade XAU/USD without indicators?
Yes. Traders can use market structure, candlesticks, support, resistance, breakouts, and price reactions without technical indicators.
Which timeframe is best for gold price action?
The one-hour and four-hour charts are useful for identifying structure and important levels. Lower timeframes can then help refine entries.
What is the best price action signal for gold?
There is no single best signal. Rejections, engulfing candles, break-and-retest setups, and false breakouts become stronger when they form at important levels.
Does price action work during gold news events?
Price action can still provide context, but major news can cause sudden volatility and slippage. Many traders reduce risk or wait until the first news spike settles.
