


RSI Strategy for Gold Trading: 14, 9 or 7 Period RSI?

Gold can drop $20, bounce $15, and reverse again within the same trading session.
The Relative Strength Index (RSI) helps traders spot changes in momentum. But the settings you choose can change what you see.
A 14-period RSI moves more slowly. A 7-period RSI reacts much faster. The 9-period setting sits between them.
So which one works best for XAU/USD?
That depends on your trading style, chart timeframe, and how you use RSI alongside price action.
Let's compare all three settings and walk through a gold trade.
How Does RSI Work in Gold Trading?
The Relative Strength Index measures the strength of recent price gains against recent losses.
It moves between 0 and 100, with three main levels traders watch:
Above 70: Gold has strong recent buying momentum and may be overbought.
Below 30: Selling has been strong, and gold may be oversold.
Around 50: Buyers and sellers have more balanced momentum.
Here's where traders get caught.
An RSI reading above 70 doesn't mean gold must fall. During strong rallies, XAU/USD can stay overbought while prices keep climbing. An oversold RSI reading becomes more useful when price is also testing an area from a XAUUSD support and resistance strategy.
The same applies below 30. Gold can remain oversold throughout a sharp selloff.
RSI works better when you compare its readings with support, resistance, and the wider trend. RSI signals become more useful when combined with reading XAU/USD charts such as trend direction and market structure.
Best RSI Settings for Gold Trading: 14, 9 or 7?
There isn't one RSI setting that works for every gold trading strategy.
Each period changes how quickly the indicator responds to price.
14-Period RSI: Best Starting Point for Gold Trading
The 14-period RSI is the standard setting on most trading platforms.
It measures momentum across the last 14 candles, smoothing out smaller price swings.
For XAU/USD, it provides a useful view of momentum on H1, H4, and daily charts.
Say gold is rising on H1. RSI reaches 75 before price starts pulling back.
Instead of selling straight away, watch how RSI behaves during that pullback.
If it holds near 40–50 and starts climbing, the uptrend may still have strength.
That's often more useful than trying to sell every reading above 70.
Best for: Intraday trend trading, swing trading, and traders who prefer fewer signals.

9-Period RSI: A Faster Setting for Intraday Gold Trades
The 9-period RSI responds to price changes sooner than RSI 14.
This makes it useful on M15 and H1 charts, especially during active London and New York sessions.
Imagine gold falls toward a support zone around $3,330.
RSI 9 drops to 32, then climbs toward 45 as buyers return.
A bullish candle closes above the previous candle's high.
The rising RSI supports the move, while the candle gives you a clear price signal.
The downside? RSI 9 also reacts to smaller price swings. Some signals will fail before a trend develops.
Best for: Intraday traders looking for earlier momentum shifts.
7-Period RSI: For Fast Gold Scalping Setups
The 7-period RSI moves quickly because it tracks only seven candles.
It can reach overbought or oversold levels during short price swings that barely affect RSI 14.
Some scalpers use it on M5 or M15 charts to spot short-term exhaustion.
Consider gold falling sharply during the New York session.
RSI 7 drops below 20, then recovers above 30.
That suggests selling pressure has eased. It doesn't confirm that a reversal has started.
Wait for price to break a short-term swing high before considering a long trade.
The faster reading comes at a cost: more false signals.
Best for: Experienced gold scalpers who use price action to confirm entries.
RSI 14 vs. 9 vs. 7: Quick Comparison
RSI setting | Suggested timeframe | Main advantage | Main weakness |
RSI 14 | H1, H4, Daily | Smoother momentum readings | Later signals |
RSI 9 | M15, H1 | Faster entry signals | More market noise |
RSI 7 | M5, M15 | Spots quick momentum shifts | Frequent false signals |
Start with RSI 14 if you're still learning. Test RSI 9 or 7 once you have clear trading rules.
A Gold Trading Strategy Using RSI and Support Levels

One practical RSI strategy for gold involves buying pullbacks during an established uptrend.
You don't need five indicators.
Start with a 50-period Exponential Moving Average (EMA), support levels, and RSI.
Here's the setup:
Find the trend. Look for higher highs and higher lows on H1 or H4.
Mark support. Identify an area where gold previously attracted buyers.
Wait for a pullback. Let price return toward support rather than chasing the rally.
Check RSI. Watch RSI 9 recover from a low reading while RSI 14 holds near 40–50.
Confirm the entry. Wait for a bullish candle and a break above its high.
Set your stop-loss. Place it below the swing low, with room for normal price movement.
The idea is to join an existing trend after a pullback, not predict the exact bottom.
In-Depth XAU/USD RSI Trading Example
Let's build a trade using RSI 9 for the entry and RSI 14 for trend confirmation.
This is a hypothetical H1 chart example. The prices and RSI readings illustrate the setup, not a verified historical trade.
Step 1: Identify the Gold Trend
Gold has climbed from $3,280 to $3,366 over several trading sessions.
The H4 chart shows higher highs and higher lows. Price also remains above its rising 50 EMA.
That gives us a bullish view.
On H1, gold has started pulling back from $3,366.
Previous buying activity places an important support zone between $3,324 and $3,331.
Rather than buying immediately, we wait for gold to test that zone.
Step 2: Watch the RSI During the Pullback
Gold falls from $3,366 toward $3,325.
Now compare the three RSI settings:
RSI 14: Falls toward 43, staying above the 40 area.
RSI 9: Drops near 33 as selling pressure increases.
RSI 7: Falls below 30 much earlier.
RSI 7 gives the earliest oversold reading. But buying at that point would be risky.
Price is still falling, and no bullish candle has formed.
RSI 14 gives us a different clue. Momentum has weakened, but the wider bullish trend remains possible.
We watch RSI 9 for the next shift.
Step 3: Confirm the Buy Entry

Gold touches $3,325 and begins recovering.
An H1 candle forms a long lower wick and closes at $3,334.
RSI 9 rises from 33 toward 47. RSI 14 also starts turning higher.
The next candle breaks above the signal candle's high.
We enter a buy trade at $3,336.
At this point, three things support the setup:
Gold has bounced from a marked support zone.
RSI 9 shows improving buying momentum.
Price has confirmed the bounce with a bullish candle.
The entry comes after confirmation, not when RSI first becomes oversold. Some traders combine RSI with the best EMA settings for trading gold to avoid takin
Step 4: Set the Stop-Loss and Take-Profit

Our trade plan looks like this:
Trade detail | Price |
Buy entry | $3,336 |
Stop-loss | $3,321 |
First target | $3,351 |
Final target | $3,366 |
Risk per ounce | $15 |
Reward at final target | $30 |
Risk-to-reward ratio | 1:2 |
The stop sits below the support zone and recent swing low.
If gold breaks that level, the bullish setup has likely failed.
The final target sits near the previous H1 high at $3,366.
That level may attract sellers, so we shouldn't assume price will break straight through it.
Step 5: Manage the Trade
Assume we're trading a $10,000 Pipstone challenge account and want to risk less than 0.5%.
Our risk budget is $50.
With a $15 stop, a position of 0.03 standard lots risks about $45, assuming 100 ounces per lot.
That excludes spread, slippage, and other trading costs. Always check your platform's contract size.
If gold reaches $3,351, the trade shows a $45 gross profit.
If it reaches $3,366, the gross profit becomes $90.
That's a 1:2 risk-to-reward ratio before costs.
You can plan to close part of the trade at the first target or hold for the second.
Make that choice before entering.
Step 6: What If the Trade Fails?
Suppose gold bounces to $3,340, then sellers return.
Price drops below $3,330 and eventually hits our stop at $3,321.
The trade loses around $45 before costs.
That's a valid loss under the plan.
Don't move the stop lower because RSI 7 has become oversold again.
The chart no longer supports the original entry. Waiting for another setup makes more sense.
Common RSI Mistakes Gold Traders Should Avoid
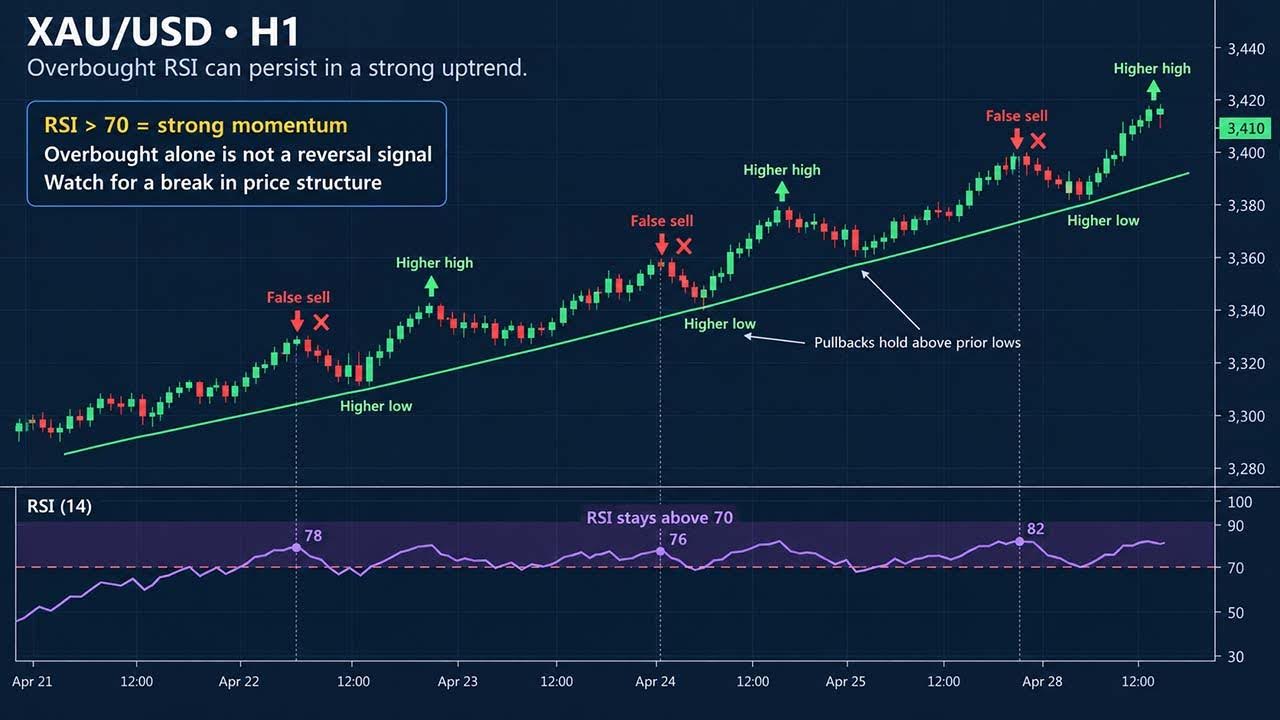
Selling every RSI reading above 70. Gold can keep rising while RSI remains overbought.
Trading RSI without support or resistance. A low RSI reading means little without a clear price level.
Changing settings after every loss. One failed RSI 9 trade doesn't mean RSI 14 would perform better.
Ignoring major news. CPI, NFP, and Federal Reserve decisions can cause sharp gold swings. RSI signals become less reliable during sudden price moves.
Backtest your setup across different market conditions. Track your entries, losses, and average reward before risking more capital.
Final Thoughts
For most gold traders, RSI 14 is a sensible starting point. RSI 9 offers faster signals, while RSI 7 suits short-term scalping.
The setting matters less than how you manage your entries and losses.
With Pipstone Capital, traders can access challenges with no time limit, simulated capital of up to $400,000, and reward splits of up to 90%, depending on the plan.
Build a clear RSI strategy, test it properly, and protect your account before chasing the next gold trade.
Frequently Asked Questions
Is RSI 9 or RSI 14 better for gold trading?
RSI 14 gives smoother signals. RSI 9 reacts faster and suits shorter intraday trades. Neither guarantees better results.
What RSI setting works best for gold scalping?
RSI 7 and RSI 9 are common starting points on M5 and M15. Use price confirmation before entering.
Should I buy gold when RSI falls below 30?
Not automatically. Wait for support to hold and price to show signs of a reversal.
Can RSI predict gold price reversals?
No. RSI shows momentum, not future prices. Divergence and price action can help spot a possible reversal.



RSI Strategy for Gold Trading: 14, 9 or 7 Period RSI?
Gold can drop $20, bounce $15, and reverse again within the same trading session.
The Relative Strength Index (RSI) helps traders spot changes in momentum. But the settings you choose can change what you see.
A 14-period RSI moves more slowly. A 7-period RSI reacts much faster. The 9-period setting sits between them.
So which one works best for XAU/USD?
That depends on your trading style, chart timeframe, and how you use RSI alongside price action.
Let's compare all three settings and walk through a gold trade.
How Does RSI Work in Gold Trading?
The Relative Strength Index measures the strength of recent price gains against recent losses.
It moves between 0 and 100, with three main levels traders watch:
Above 70: Gold has strong recent buying momentum and may be overbought.
Below 30: Selling has been strong, and gold may be oversold.
Around 50: Buyers and sellers have more balanced momentum.
Here's where traders get caught.
An RSI reading above 70 doesn't mean gold must fall. During strong rallies, XAU/USD can stay overbought while prices keep climbing. An oversold RSI reading becomes more useful when price is also testing an area from a XAUUSD support and resistance strategy.
The same applies below 30. Gold can remain oversold throughout a sharp selloff.
RSI works better when you compare its readings with support, resistance, and the wider trend. RSI signals become more useful when combined with reading XAU/USD charts such as trend direction and market structure.
Best RSI Settings for Gold Trading: 14, 9 or 7?
There isn't one RSI setting that works for every gold trading strategy.
Each period changes how quickly the indicator responds to price.
14-Period RSI: Best Starting Point for Gold Trading
The 14-period RSI is the standard setting on most trading platforms.
It measures momentum across the last 14 candles, smoothing out smaller price swings.
For XAU/USD, it provides a useful view of momentum on H1, H4, and daily charts.
Say gold is rising on H1. RSI reaches 75 before price starts pulling back.
Instead of selling straight away, watch how RSI behaves during that pullback.
If it holds near 40–50 and starts climbing, the uptrend may still have strength.
That's often more useful than trying to sell every reading above 70.
Best for: Intraday trend trading, swing trading, and traders who prefer fewer signals.
9-Period RSI: A Faster Setting for Intraday Gold Trades
The 9-period RSI responds to price changes sooner than RSI 14.
This makes it useful on M15 and H1 charts, especially during active London and New York sessions.
Imagine gold falls toward a support zone around $3,330.
RSI 9 drops to 32, then climbs toward 45 as buyers return.
A bullish candle closes above the previous candle's high.
The rising RSI supports the move, while the candle gives you a clear price signal.
The downside? RSI 9 also reacts to smaller price swings. Some signals will fail before a trend develops.
Best for: Intraday traders looking for earlier momentum shifts.
7-Period RSI: For Fast Gold Scalping Setups
The 7-period RSI moves quickly because it tracks only seven candles.
It can reach overbought or oversold levels during short price swings that barely affect RSI 14.
Some scalpers use it on M5 or M15 charts to spot short-term exhaustion.
Consider gold falling sharply during the New York session.
RSI 7 drops below 20, then recovers above 30.
That suggests selling pressure has eased. It doesn't confirm that a reversal has started.
Wait for price to break a short-term swing high before considering a long trade.
The faster reading comes at a cost: more false signals.
Best for: Experienced gold scalpers who use price action to confirm entries.
RSI 14 vs. 9 vs. 7: Quick Comparison
RSI setting | Suggested timeframe | Main advantage | Main weakness |
RSI 14 | H1, H4, Daily | Smoother momentum readings | Later signals |
RSI 9 | M15, H1 | Faster entry signals | More market noise |
RSI 7 | M5, M15 | Spots quick momentum shifts | Frequent false signals |
Start with RSI 14 if you're still learning. Test RSI 9 or 7 once you have clear trading rules.
A Gold Trading Strategy Using RSI and Support Levels
One practical RSI strategy for gold involves buying pullbacks during an established uptrend.
You don't need five indicators.
Start with a 50-period Exponential Moving Average (EMA), support levels, and RSI.
Here's the setup:
Find the trend. Look for higher highs and higher lows on H1 or H4.
Mark support. Identify an area where gold previously attracted buyers.
Wait for a pullback. Let price return toward support rather than chasing the rally.
Check RSI. Watch RSI 9 recover from a low reading while RSI 14 holds near 40–50.
Confirm the entry. Wait for a bullish candle and a break above its high.
Set your stop-loss. Place it below the swing low, with room for normal price movement.
The idea is to join an existing trend after a pullback, not predict the exact bottom.
In-Depth XAU/USD RSI Trading Example
Let's build a trade using RSI 9 for the entry and RSI 14 for trend confirmation.
This is a hypothetical H1 chart example. The prices and RSI readings illustrate the setup, not a verified historical trade.
Step 1: Identify the Gold Trend
Gold has climbed from $3,280 to $3,366 over several trading sessions.
The H4 chart shows higher highs and higher lows. Price also remains above its rising 50 EMA.
That gives us a bullish view.
On H1, gold has started pulling back from $3,366.
Previous buying activity places an important support zone between $3,324 and $3,331.
Rather than buying immediately, we wait for gold to test that zone.
Step 2: Watch the RSI During the Pullback
Gold falls from $3,366 toward $3,325.
Now compare the three RSI settings:
RSI 14: Falls toward 43, staying above the 40 area.
RSI 9: Drops near 33 as selling pressure increases.
RSI 7: Falls below 30 much earlier.
RSI 7 gives the earliest oversold reading. But buying at that point would be risky.
Price is still falling, and no bullish candle has formed.
RSI 14 gives us a different clue. Momentum has weakened, but the wider bullish trend remains possible.
We watch RSI 9 for the next shift.
Step 3: Confirm the Buy Entry
Gold touches $3,325 and begins recovering.
An H1 candle forms a long lower wick and closes at $3,334.
RSI 9 rises from 33 toward 47. RSI 14 also starts turning higher.
The next candle breaks above the signal candle's high.
We enter a buy trade at $3,336.
At this point, three things support the setup:
Gold has bounced from a marked support zone.
RSI 9 shows improving buying momentum.
Price has confirmed the bounce with a bullish candle.
The entry comes after confirmation, not when RSI first becomes oversold. Some traders combine RSI with the best EMA settings for trading gold to avoid takin
Step 4: Set the Stop-Loss and Take-Profit
Our trade plan looks like this:
Trade detail | Price |
Buy entry | $3,336 |
Stop-loss | $3,321 |
First target | $3,351 |
Final target | $3,366 |
Risk per ounce | $15 |
Reward at final target | $30 |
Risk-to-reward ratio | 1:2 |
The stop sits below the support zone and recent swing low.
If gold breaks that level, the bullish setup has likely failed.
The final target sits near the previous H1 high at $3,366.
That level may attract sellers, so we shouldn't assume price will break straight through it.
Step 5: Manage the Trade
Assume we're trading a $10,000 Pipstone challenge account and want to risk less than 0.5%.
Our risk budget is $50.
With a $15 stop, a position of 0.03 standard lots risks about $45, assuming 100 ounces per lot.
That excludes spread, slippage, and other trading costs. Always check your platform's contract size.
If gold reaches $3,351, the trade shows a $45 gross profit.
If it reaches $3,366, the gross profit becomes $90.
That's a 1:2 risk-to-reward ratio before costs.
You can plan to close part of the trade at the first target or hold for the second.
Make that choice before entering.
Step 6: What If the Trade Fails?
Suppose gold bounces to $3,340, then sellers return.
Price drops below $3,330 and eventually hits our stop at $3,321.
The trade loses around $45 before costs.
That's a valid loss under the plan.
Don't move the stop lower because RSI 7 has become oversold again.
The chart no longer supports the original entry. Waiting for another setup makes more sense.
Common RSI Mistakes Gold Traders Should Avoid
Selling every RSI reading above 70. Gold can keep rising while RSI remains overbought.
Trading RSI without support or resistance. A low RSI reading means little without a clear price level.
Changing settings after every loss. One failed RSI 9 trade doesn't mean RSI 14 would perform better.
Ignoring major news. CPI, NFP, and Federal Reserve decisions can cause sharp gold swings. RSI signals become less reliable during sudden price moves.
Backtest your setup across different market conditions. Track your entries, losses, and average reward before risking more capital.
Final Thoughts
For most gold traders, RSI 14 is a sensible starting point. RSI 9 offers faster signals, while RSI 7 suits short-term scalping.
The setting matters less than how you manage your entries and losses.
With Pipstone Capital, traders can access challenges with no time limit, simulated capital of up to $400,000, and reward splits of up to 90%, depending on the plan.
Build a clear RSI strategy, test it properly, and protect your account before chasing the next gold trade.
Frequently Asked Questions
Is RSI 9 or RSI 14 better for gold trading?
RSI 14 gives smoother signals. RSI 9 reacts faster and suits shorter intraday trades. Neither guarantees better results.
What RSI setting works best for gold scalping?
RSI 7 and RSI 9 are common starting points on M5 and M15. Use price confirmation before entering.
Should I buy gold when RSI falls below 30?
Not automatically. Wait for support to hold and price to show signs of a reversal.
Can RSI predict gold price reversals?
No. RSI shows momentum, not future prices. Divergence and price action can help spot a possible reversal.
