


How to Use ATR Indicator for Smarter Stop Loss Placement

Most traders know they need a stop loss. The hard part is knowing where to place it.
Place it too close, and normal market noise knocks you out before the trade has a chance to work. Place it too far, and one bad trade can take more from your account than it should.
This is where the ATR indicator can help.
The ATR indicator stands for Average True Range. It measures how much price is moving on average over a set number of candles. It does not tell you whether to buy or sell. It does not predict the next move. It simply shows how active or quiet the market is right now.
That makes the ATR indicator extremely useful for stop loss placement.
Instead of using the same 20-pip or 50-pip stop on every trade, the indicator helps you adjust your stop based on current market movement. When the market is volatile, your stop needs more room. When the market is calm, your stop can often be tighter.
Used well, the average true range indicator can help you avoid random stop-outs, manage risk better, and build a cleaner trading plan.
What Is ATR Indicator?
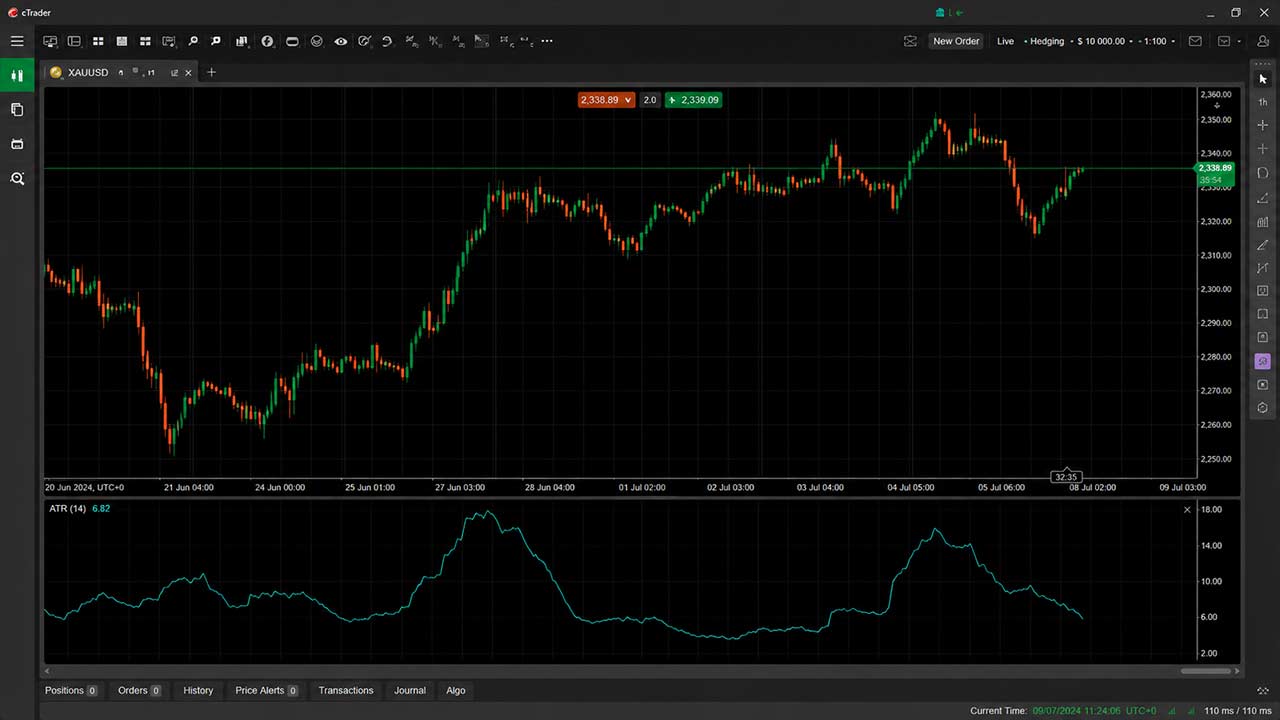
If you're wondering what is ATR indicator, it is a volatility tool that shows the average price range over a set number of candles. Most trading platforms use a default ATR setting of 14 periods.
If you want a broader understanding before applying it to stop losses, read our guide on what ATR tells you before every trade, which explains how traders use ATR to read market volatility before making trading decisions.
On a 1-hour chart, a 14-period ATR shows the average true range over the last 14 hourly candles. If you are looking at a daily chart, it shows the average true range over the last 14 daily candles.
The average true range indicator is based on true range, which looks at the largest price movement between:
The current high and current low
The current high and previous close
The current low and previous close
This matters because markets can gap or move sharply between sessions. The ATR indicator accounts for that better than a simple high-low range.
The key thing to remember when learning how to read ATR indicator is this:
The average true range indicator measures volatility, not direction.
A rising ATR means price movement is getting larger. A falling ATR means price movement is getting smaller. It does not mean the market is bullish or bearish.
For stop loss placement, that is fine. You are not using the ATR indicator to predict the trade. You are using it to decide how much breathing room your trade needs.

Why Fixed Stop Losses Often Fail
Many traders use fixed stops because they are simple.
For example:
A trader may always use a 20-pip stop on EUR/USD. Another may always use a $5 stop on gold. Someone else may always place their stop 10 points away on an index.
The problem is that markets do not move the same way every day.
A 20-pip stop may be too wide during a slow Asian session, but far too tight during a major news event. A $5 stop on gold may work during quiet conditions, but it may get wiped out fast when XAU/USD is moving heavily.
The market does not care about your fixed number.
It moves based on liquidity, news, session volume, order flow, and volatility. The ATR indicator helps you respect that. It gives you a real reading of current movement, so your stop is based on the market instead of a random number.
Once you understand volatility, it's much easier to build a consistent stop loss and take profit strategy that adapts to changing market conditions.
How to Use Average True Range Indicator for Smarter Stop Loss Placement
Understanding how to use ATR indicator in trading starts with one simple question:
“How much room does this trade need before I can fairly say the setup is wrong?”
That question matters.
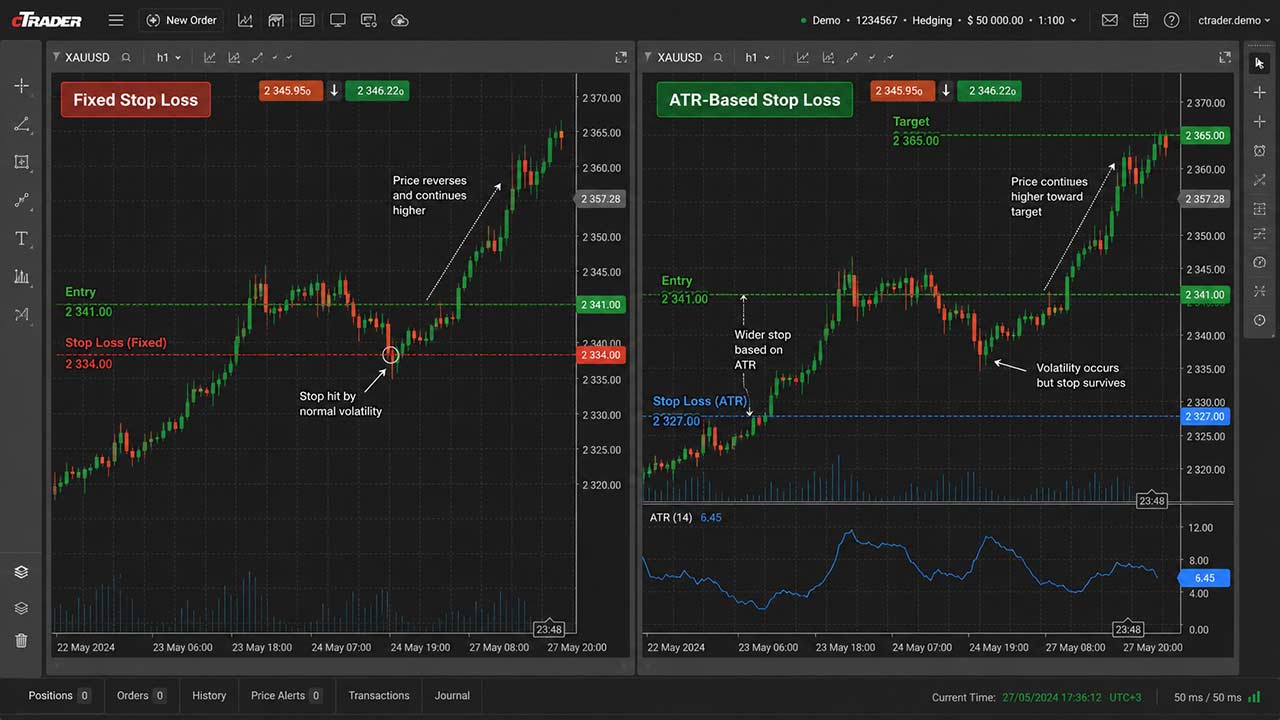
A stop loss should not be placed where price can easily touch it during normal movement. It should be placed where your trade idea no longer makes sense.
This approach becomes even more effective when it forms part of a disciplined risk management in prop trading, where every position is sized according to current market conditions rather than emotion.
The average true range indicator gives you a volatility buffer.
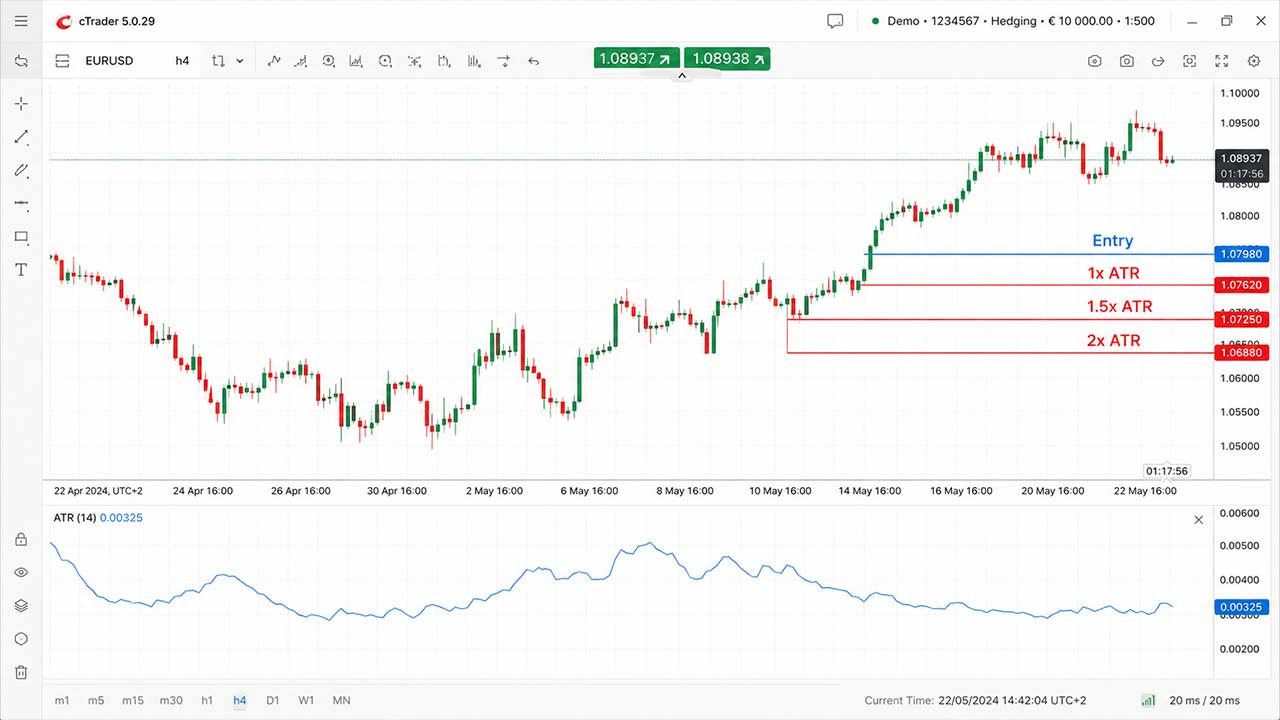
For example, if EUR/USD has a 14-period ATR of 30 pips on the timeframe you trade, then a 10-pip stop may be too tight. Price can move 10 pips as part of normal noise. You may get stopped out even if your trade idea is still valid.
If the ATR is 30 pips, a stop based around 1x ATR, 1.5x ATR, or 2x ATR may make more sense depending on your setup.
This is a core part of learning how to use ATR indicator effectively.
A tight scalp may use a smaller ATR buffer. A swing trade may need a wider one. A breakout trade may need room beyond the breakout zone. A reversal trade may need room beyond the recent high or low.
The ATR indicator helps you match the stop to the market.
The Basic ATR Indicator Stop Loss Formula
A simple ATR indicator stop loss formula looks like this:
For a buy trade:
Stop loss = Entry price - ATR value × multiplier
For a sell trade:
Stop loss = Entry price + ATR value × multiplier
The multiplier can change based on your trading style.
Common ATR multipliers include:
1x ATR for tighter trades
1.5x ATR for balanced stops
2x ATR for wider stops
3x ATR for slower swing trades
Let’s say you enter a buy trade on EUR/USD at 1.0900. The ATR is 25 pips. You choose a 1.5x ATR stop.
25 pips × 1.5 = 37.5 pips
Your stop would be around 37 or 38 pips below your entry.
So the stop would sit near 1.0862.
This stop is not random. It is based on the current movement measured by the average true range indicator.
Match Average True Range Indicator to Your Trading Timeframe
One common mistake when learning how to use ATR indicator in trading is using ATR from the wrong timeframe.
If you trade on the 15-minute chart, use the indicator from the 15-minute chart. If you trade on the 4-hour chart, use it from the 4-hour chart.
The ATR value changes based on timeframe.
A daily ATR may show that gold moves $30 per day on average. That does not mean you should use a $30 stop on a 5-minute scalp.
Your stop should match the timeframe of your setup.
For day trading, many traders use the ATR indicator on the same chart they use for entries. Some also check a higher timeframe to understand the wider market condition.
Use ATR Indicator with Market Structure
The indicator is powerful, but it should not replace market structure.
A smart stop loss often combines the average true range indicator with support, resistance, swing highs, swing lows, or trend structure.
For a buy trade, you may want your stop below a recent swing low. The average true range indicator can help you decide how far below that swing low the stop should go.
For a sell trade, you may want your stop above a recent swing high.
This is important because many traders place stops right at obvious highs and lows. Price can sweep those levels, trigger stops, and then continue in the original direction.
The ATR indicator gives you a buffer.
Image Brief 4: A chart showing support and resistance levels with stop losses placed slightly beyond them using ATR-based buffers.
Adjust Position Size When Average True Range Indicator Is High
A wider stop does not mean you should risk more money.
If the ATR indicator is high and your stop needs to be wider, your lot size should usually be smaller. That way, your account risk stays the same.
For example, let’s say you risk $100 per trade.
On a quiet day, your ATR-based stop may be 25 pips. On a volatile day, your ATR-based stop may be 50 pips.
If you use the same lot size on both trades, the second trade risks twice as much money.
The ATR indicator should guide both your stop distance and position size. At the same time, every trade should still offer a favorable risk-to-reward ratio, so the potential reward justifies the amount you are risking.
ATR Indicator Stop Loss Example
Let’s walk through a simple example of how to use ATR indicator.
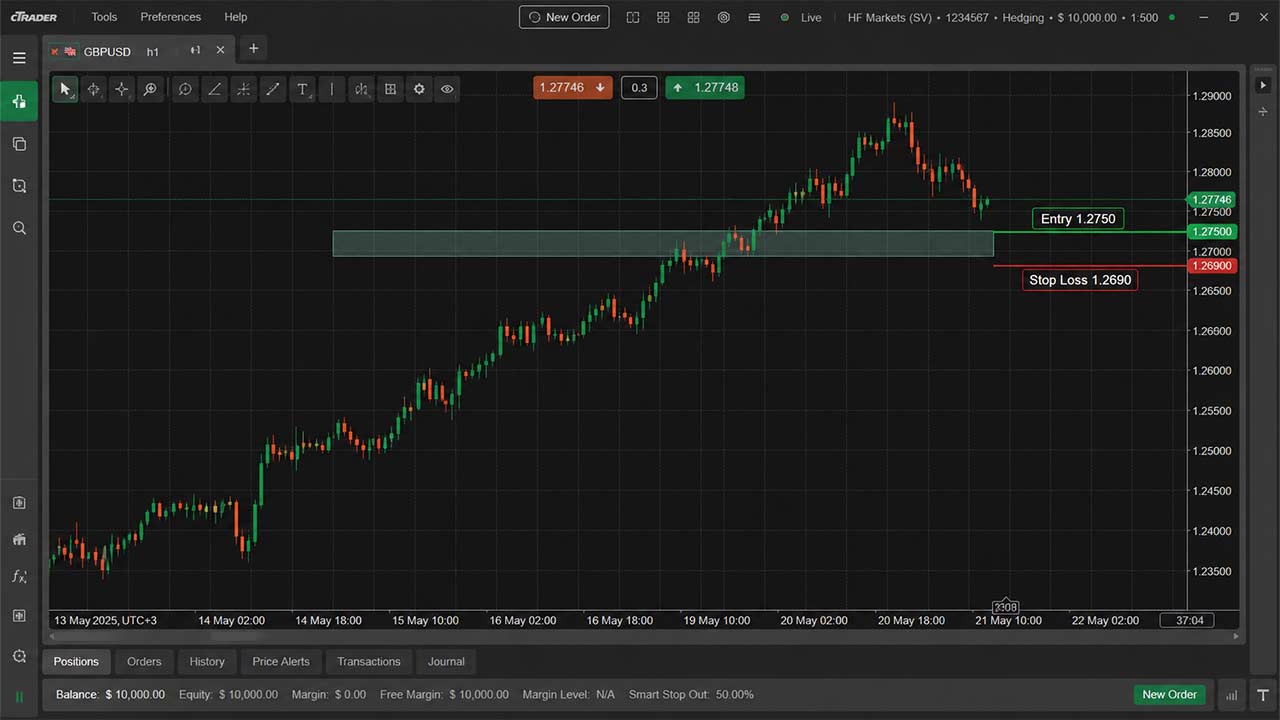
You are trading GBP/USD on the 1-hour chart. Price is trending upward and pulls back to a support area.
Your entry is 1.2750.
The current 14-period ATR is 40 pips.
You decide to use a 1.5x ATR stop.
40 pips × 1.5 = 60 pips
Your stop loss would be:
1.2750 - 60 pips = 1.2690
This shows how the ATR indicator helps place a logical stop beyond structure.
ATR Indicator Trailing Stops
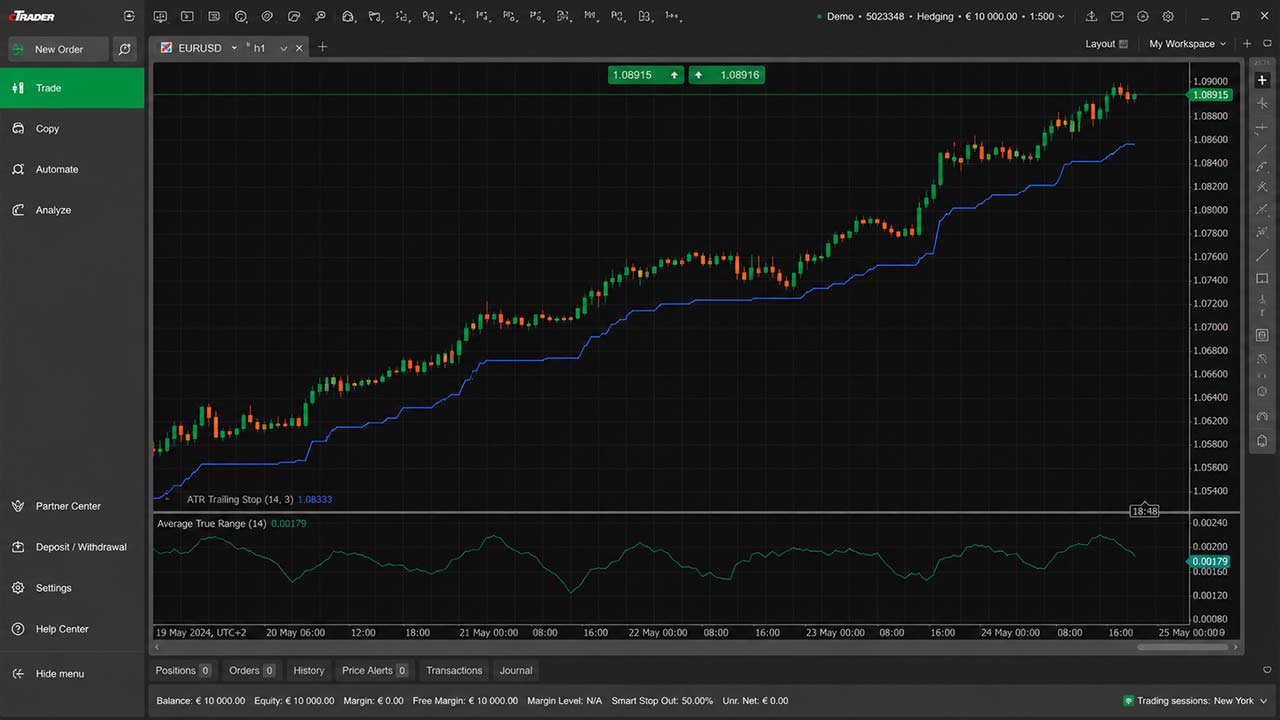
The ATR indicator can also help with trailing stops.
A trailing stop moves as price moves in your favor. One common method is to trail the stop by 1.5x or 2x ATR.
This approach works well in trending markets because the ATR indicator adjusts to volatility.
If the market becomes more active, the ATR may rise and give the trade more room. If the market slows down, the ATR may fall and tighten the stop.
Best ATR Indicator Settings for Stop Loss Placement
The default average true range indicator setting is 14 periods, and it works well as a starting point.
Shorter settings react faster to recent volatility. Longer settings react slower and are smoother.
There is no perfect setting for the ATR indicator.
The best setting depends on the market, timeframe, and strategy.
Common ATR Indicator Mistakes
When learning how to read average true range indicator, traders often make mistakes:
Using the average true range indicator as an entry signal
Ignoring market direction
Using the same multiplier in every market
Forgetting position size adjustments
Ignoring structure
The indicator should always be used with context.
When Does it Work Best
The ATR indicator works best when the market has clear movement.
It is useful in trending markets, breakout trades, and volatile sessions.
It is less effective in choppy, range-bound markets.
Final Thoughts
The ATR indicator is one of the most useful tools for smarter stop loss placement because it keeps your risk plan tied to real market movement.
It helps you avoid stops that are too tight during volatile conditions and oversized stops when the market is quiet.
But the indicator should not be used alone.
The best way to use the average true range indicator is with market structure, price action, and fixed account risk.
A smart stop loss is not about guessing the perfect distance. It is about placing your stop where the trade no longer makes sense.
That is where the ATR indicator can make a real difference, especially for traders joining firms like Pipestone Capital, where disciplined risk management, structured evaluation rules, and consistent trading performance are essential for long-term success.
FAQs: Average True Range Indicator
What is ATR indicator used for?
The ATR indicator is used to measure market volatility and help traders set stop losses and position sizes.
How to use ATR indicator in trading?
To learn how to use average true range indicator in trading, apply it to your chart and use its value to set stop losses based on volatility.
How to read ATR indicator?
Understanding how to read ATR indicator is simple: rising ATR means higher volatility, falling ATR means lower volatility.
Can Average True Range Indicator be used for all markets?
Yes, the average true range indicator works on forex, stocks, crypto, and commodities.
What is the best setting for ATR indicator?
The default 14-period setting is widely used, but traders can adjust it based on their strategy.
Can it help with making a profit?
Yes, some traders use the average true range indicator to set realistic profit targets based on average price movement.



How to Use ATR Indicator for Smarter Stop Loss Placement
Most traders know they need a stop loss. The hard part is knowing where to place it.
Place it too close, and normal market noise knocks you out before the trade has a chance to work. Place it too far, and one bad trade can take more from your account than it should.
This is where the ATR indicator can help.
The ATR indicator stands for Average True Range. It measures how much price is moving on average over a set number of candles. It does not tell you whether to buy or sell. It does not predict the next move. It simply shows how active or quiet the market is right now.
That makes the ATR indicator extremely useful for stop loss placement.
Instead of using the same 20-pip or 50-pip stop on every trade, the indicator helps you adjust your stop based on current market movement. When the market is volatile, your stop needs more room. When the market is calm, your stop can often be tighter.
Used well, the average true range indicator can help you avoid random stop-outs, manage risk better, and build a cleaner trading plan.
What Is ATR Indicator?
If you're wondering what is ATR indicator, it is a volatility tool that shows the average price range over a set number of candles. Most trading platforms use a default ATR setting of 14 periods.
If you want a broader understanding before applying it to stop losses, read our guide on what ATR tells you before every trade, which explains how traders use ATR to read market volatility before making trading decisions.
On a 1-hour chart, a 14-period ATR shows the average true range over the last 14 hourly candles. If you are looking at a daily chart, it shows the average true range over the last 14 daily candles.
The average true range indicator is based on true range, which looks at the largest price movement between:
The current high and current low
The current high and previous close
The current low and previous close
This matters because markets can gap or move sharply between sessions. The ATR indicator accounts for that better than a simple high-low range.
The key thing to remember when learning how to read ATR indicator is this:
The average true range indicator measures volatility, not direction.
A rising ATR means price movement is getting larger. A falling ATR means price movement is getting smaller. It does not mean the market is bullish or bearish.
For stop loss placement, that is fine. You are not using the ATR indicator to predict the trade. You are using it to decide how much breathing room your trade needs.
Why Fixed Stop Losses Often Fail
Many traders use fixed stops because they are simple.
For example:
A trader may always use a 20-pip stop on EUR/USD. Another may always use a $5 stop on gold. Someone else may always place their stop 10 points away on an index.
The problem is that markets do not move the same way every day.
A 20-pip stop may be too wide during a slow Asian session, but far too tight during a major news event. A $5 stop on gold may work during quiet conditions, but it may get wiped out fast when XAU/USD is moving heavily.
The market does not care about your fixed number.
It moves based on liquidity, news, session volume, order flow, and volatility. The ATR indicator helps you respect that. It gives you a real reading of current movement, so your stop is based on the market instead of a random number.
Once you understand volatility, it's much easier to build a consistent stop loss and take profit strategy that adapts to changing market conditions.
How to Use Average True Range Indicator for Smarter Stop Loss Placement
Understanding how to use ATR indicator in trading starts with one simple question:
“How much room does this trade need before I can fairly say the setup is wrong?”
That question matters.
A stop loss should not be placed where price can easily touch it during normal movement. It should be placed where your trade idea no longer makes sense.
This approach becomes even more effective when it forms part of a disciplined risk management in prop trading, where every position is sized according to current market conditions rather than emotion.
The average true range indicator gives you a volatility buffer.
For example, if EUR/USD has a 14-period ATR of 30 pips on the timeframe you trade, then a 10-pip stop may be too tight. Price can move 10 pips as part of normal noise. You may get stopped out even if your trade idea is still valid.
If the ATR is 30 pips, a stop based around 1x ATR, 1.5x ATR, or 2x ATR may make more sense depending on your setup.
This is a core part of learning how to use ATR indicator effectively.
A tight scalp may use a smaller ATR buffer. A swing trade may need a wider one. A breakout trade may need room beyond the breakout zone. A reversal trade may need room beyond the recent high or low.
The ATR indicator helps you match the stop to the market.
The Basic ATR Indicator Stop Loss Formula
A simple ATR indicator stop loss formula looks like this:
For a buy trade:
Stop loss = Entry price - ATR value × multiplier
For a sell trade:
Stop loss = Entry price + ATR value × multiplier
The multiplier can change based on your trading style.
Common ATR multipliers include:
1x ATR for tighter trades
1.5x ATR for balanced stops
2x ATR for wider stops
3x ATR for slower swing trades
Let’s say you enter a buy trade on EUR/USD at 1.0900. The ATR is 25 pips. You choose a 1.5x ATR stop.
25 pips × 1.5 = 37.5 pips
Your stop would be around 37 or 38 pips below your entry.
So the stop would sit near 1.0862.
This stop is not random. It is based on the current movement measured by the average true range indicator.
Match Average True Range Indicator to Your Trading Timeframe
One common mistake when learning how to use ATR indicator in trading is using ATR from the wrong timeframe.
If you trade on the 15-minute chart, use the indicator from the 15-minute chart. If you trade on the 4-hour chart, use it from the 4-hour chart.
The ATR value changes based on timeframe.
A daily ATR may show that gold moves $30 per day on average. That does not mean you should use a $30 stop on a 5-minute scalp.
Your stop should match the timeframe of your setup.
For day trading, many traders use the ATR indicator on the same chart they use for entries. Some also check a higher timeframe to understand the wider market condition.
Use ATR Indicator with Market Structure
The indicator is powerful, but it should not replace market structure.
A smart stop loss often combines the average true range indicator with support, resistance, swing highs, swing lows, or trend structure.
For a buy trade, you may want your stop below a recent swing low. The average true range indicator can help you decide how far below that swing low the stop should go.
For a sell trade, you may want your stop above a recent swing high.
This is important because many traders place stops right at obvious highs and lows. Price can sweep those levels, trigger stops, and then continue in the original direction.
The ATR indicator gives you a buffer.
Image Brief 4: A chart showing support and resistance levels with stop losses placed slightly beyond them using ATR-based buffers.
Adjust Position Size When Average True Range Indicator Is High
A wider stop does not mean you should risk more money.
If the ATR indicator is high and your stop needs to be wider, your lot size should usually be smaller. That way, your account risk stays the same.
For example, let’s say you risk $100 per trade.
On a quiet day, your ATR-based stop may be 25 pips. On a volatile day, your ATR-based stop may be 50 pips.
If you use the same lot size on both trades, the second trade risks twice as much money.
The ATR indicator should guide both your stop distance and position size. At the same time, every trade should still offer a favorable risk-to-reward ratio, so the potential reward justifies the amount you are risking.
ATR Indicator Stop Loss Example
Let’s walk through a simple example of how to use ATR indicator.
You are trading GBP/USD on the 1-hour chart. Price is trending upward and pulls back to a support area.
Your entry is 1.2750.
The current 14-period ATR is 40 pips.
You decide to use a 1.5x ATR stop.
40 pips × 1.5 = 60 pips
Your stop loss would be:
1.2750 - 60 pips = 1.2690
This shows how the ATR indicator helps place a logical stop beyond structure.
ATR Indicator Trailing Stops
The ATR indicator can also help with trailing stops.
A trailing stop moves as price moves in your favor. One common method is to trail the stop by 1.5x or 2x ATR.
This approach works well in trending markets because the ATR indicator adjusts to volatility.
If the market becomes more active, the ATR may rise and give the trade more room. If the market slows down, the ATR may fall and tighten the stop.
Best ATR Indicator Settings for Stop Loss Placement
The default average true range indicator setting is 14 periods, and it works well as a starting point.
Shorter settings react faster to recent volatility. Longer settings react slower and are smoother.
There is no perfect setting for the ATR indicator.
The best setting depends on the market, timeframe, and strategy.
Common ATR Indicator Mistakes
When learning how to read average true range indicator, traders often make mistakes:
Using the average true range indicator as an entry signal
Ignoring market direction
Using the same multiplier in every market
Forgetting position size adjustments
Ignoring structure
The indicator should always be used with context.
When Does it Work Best
The ATR indicator works best when the market has clear movement.
It is useful in trending markets, breakout trades, and volatile sessions.
It is less effective in choppy, range-bound markets.
Final Thoughts
The ATR indicator is one of the most useful tools for smarter stop loss placement because it keeps your risk plan tied to real market movement.
It helps you avoid stops that are too tight during volatile conditions and oversized stops when the market is quiet.
But the indicator should not be used alone.
The best way to use the average true range indicator is with market structure, price action, and fixed account risk.
A smart stop loss is not about guessing the perfect distance. It is about placing your stop where the trade no longer makes sense.
That is where the ATR indicator can make a real difference, especially for traders joining firms like Pipestone Capital, where disciplined risk management, structured evaluation rules, and consistent trading performance are essential for long-term success.
FAQs: Average True Range Indicator
What is ATR indicator used for?
The ATR indicator is used to measure market volatility and help traders set stop losses and position sizes.
How to use ATR indicator in trading?
To learn how to use average true range indicator in trading, apply it to your chart and use its value to set stop losses based on volatility.
How to read ATR indicator?
Understanding how to read ATR indicator is simple: rising ATR means higher volatility, falling ATR means lower volatility.
Can Average True Range Indicator be used for all markets?
Yes, the average true range indicator works on forex, stocks, crypto, and commodities.
What is the best setting for ATR indicator?
The default 14-period setting is widely used, but traders can adjust it based on their strategy.
Can it help with making a profit?
Yes, some traders use the average true range indicator to set realistic profit targets based on average price movement.
