


ATR in Trading: What It Tells You Before Every Trade

Most traders look at price first. They check if the market is moving up, down, or sideways. Then they look for an entry.
That is normal. But it misses one key question.
How much is this market moving right now?
That is where Average True Range in trading becomes important.
ATR stands for Average True Range. If you are wondering about the ATR full form in trading, it simply refers to a volatility indicator that measures how much price moves over a specific period.
Average True Range does not tell you if price will go up or down. It does not give buy or sell signals on its own. Instead, Average True Range in trading tells you how active the market is. That single detail can change how you place stops, set targets, size your trades, and decide whether a setup is worth taking.
Before every trade, Average True Range helps you answer one simple question:
Is this market quiet, normal, or moving aggressively?
That answer matters more than many traders think.
What Is ATR in Trading?
Average True Range in trading is a volatility indicator created by J. Welles Wilder Jr. Traders use it to measure the average size of price movement over a set number of candles.
The most common Average True Range setting is 14 periods. On a daily chart, that means Average True Range looks at the past 14 daily candles. On a 1-hour chart, it looks at the past 14 hourly candles. On a 15-minute chart, it looks at the past 14 15-minute candles.
The idea is simple. Average True Range in trading looks at how much price has been moving and gives you an average reading.
For example, if Gold has an Average True Range of 20 on the daily chart, it means Gold has been moving around $20 per day on average over the selected period. If EUR/USD has an Average True Range of 0.0060 on the daily chart, it means the pair has been moving around 60 pips per day on average.
The exact value depends on the market and chart timeframe.
This is why Average True Range in trading should not be compared blindly across different assets. A stock trading at $500 will usually have a higher Average True Range than a stock trading at $20. Gold will show different Average True Range values than a forex pair. Bitcoin will show different Average True Range values than a major currency pair.
Average True Range works best when you compare the current reading against the same market’s past behavior.
What Average True Range Actually Tells You
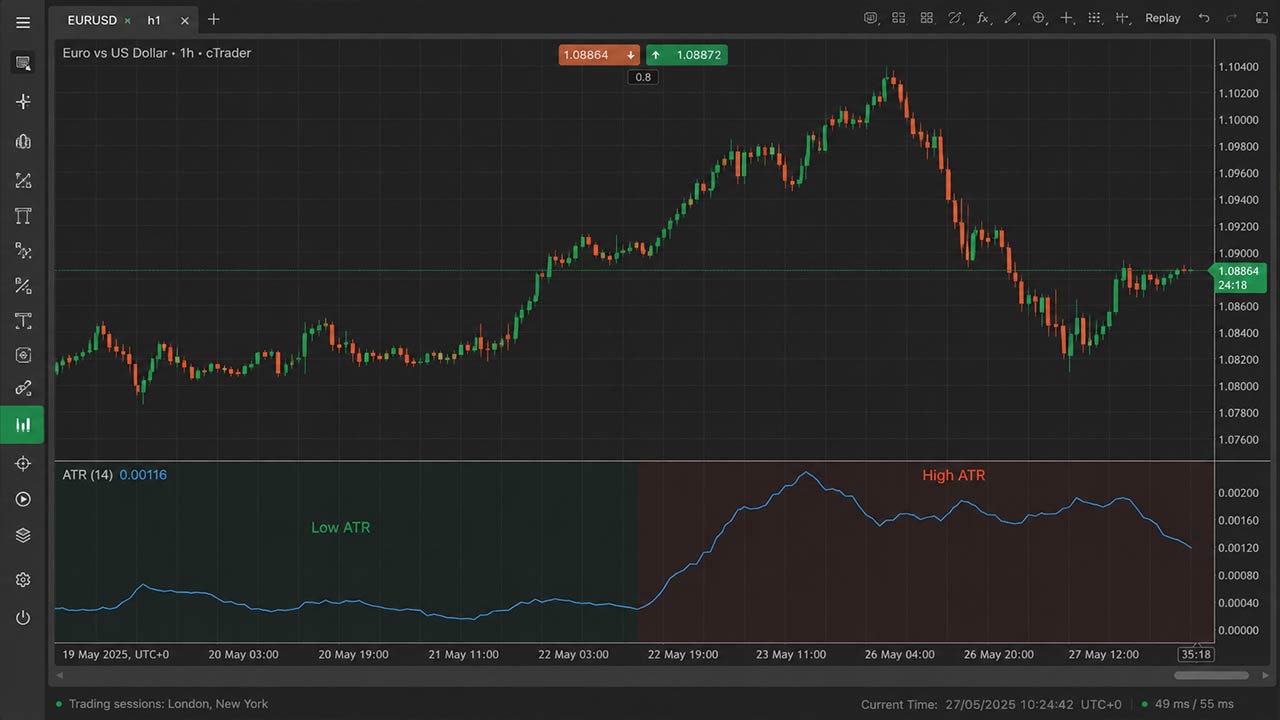
Average True Range in trading tells you how much price is moving. That is it.
It does not tell you price direction. A rising Average True Range does not mean the market is bullish. A falling Average True Range does not mean the market is bearish.
Average True Range can rise during a strong rally. It can also rise during a sharp selloff. It only tells you that movement is getting larger.
This is why Average True Range in trading is useful before entering a trade. It gives context.
A setup during low Average True Range is not the same as a setup during high Average True Range. A breakout during a quiet market may need different stop placement than a breakout during a high-volatility session. A fixed 20-pip stop might make sense in one market condition and be too tight in another.
Average True Range helps you stop guessing.

How ATR Is Calculated
You do not need to calculate Average True Range in trading by hand because most trading platforms do it for you. But it helps to understand what is behind it.
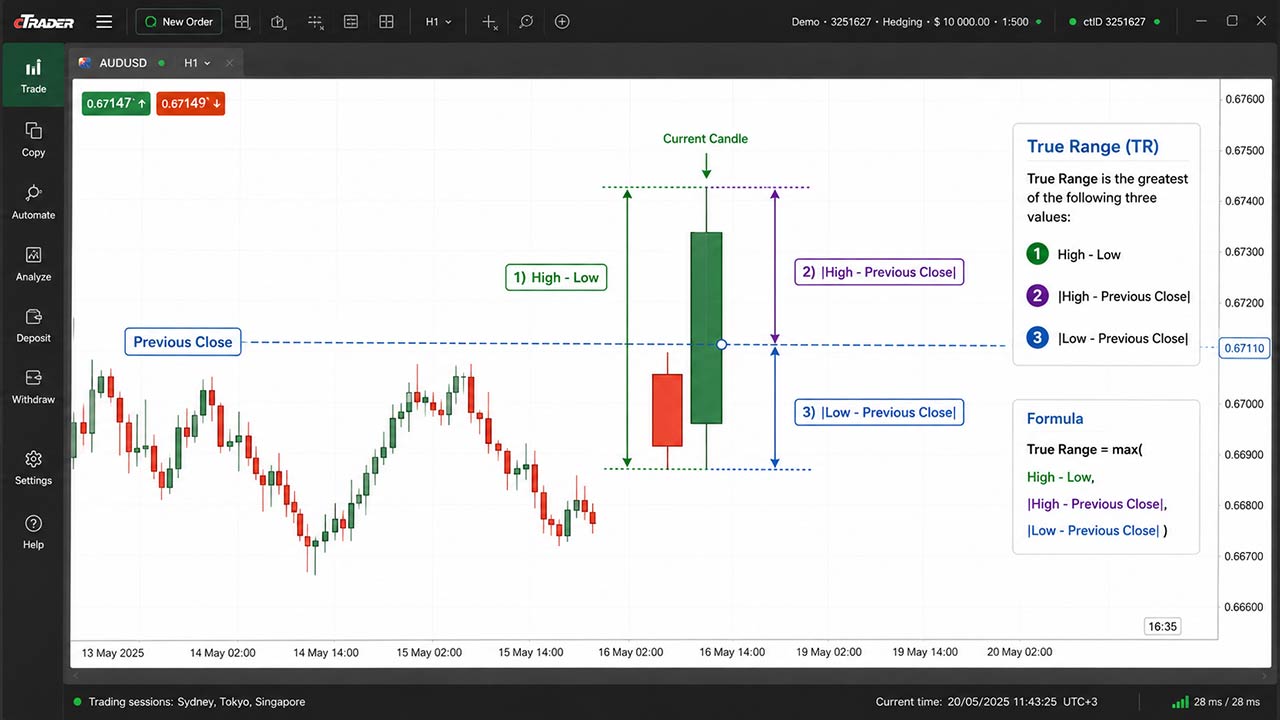
Average True Range starts with True Range.
True Range is the largest of these three values:
Current high minus current low
Current high minus the previous close
Current low minus the previous close
The second and third options use absolute values, so negative numbers are ignored. The goal is to measure movement, not direction.
This matters because markets do not always move smoothly from one candle to the next. Sometimes there are gaps. Sometimes price opens far above or below the previous close. True Range accounts for that.
After True Range is calculated, Average True Range averages those values over the chosen period.
The default setting is often 14 periods. Some traders use shorter settings like 5 or 10 to focus on recent movement. Others use longer settings like 20 or 50 to smooth the reading.
A shorter Average True Range reacts faster. A longer Average True Range is smoother but slower.
Neither is “best” for every trader. It depends on your trading style.
Why ATR Matters Before Every Trade
Many traders enter trades based only on direction. They see a bullish setup and buy. They see a bearish setup and sell.
The problem is that direction is only part of the trade.
You also need to know whether the market is moving enough to make the trade worth it. You need to know where your stop has enough room. You need to know if your target is realistic.
Average True Range in trading helps with all of that.
Before taking a trade, Average True Range can help you answer:
Can price realistically reach my target?
Is my stop too close?
Is the market too quiet?
Is volatility too high for my normal risk?
Should I reduce my position size?
Should I skip the trade?
These questions keep traders out of weak setups and help them manage stronger ones with more care.
How to Use ATR for Stop-Loss Placement
One of the most practical ways to understand how to use ATR in trading is through stop-loss placement.
Many traders place stops based on random numbers. For example, they always use a 20-pip stop or a $10 stop. That may sound simple, but markets do not move the same way every day.
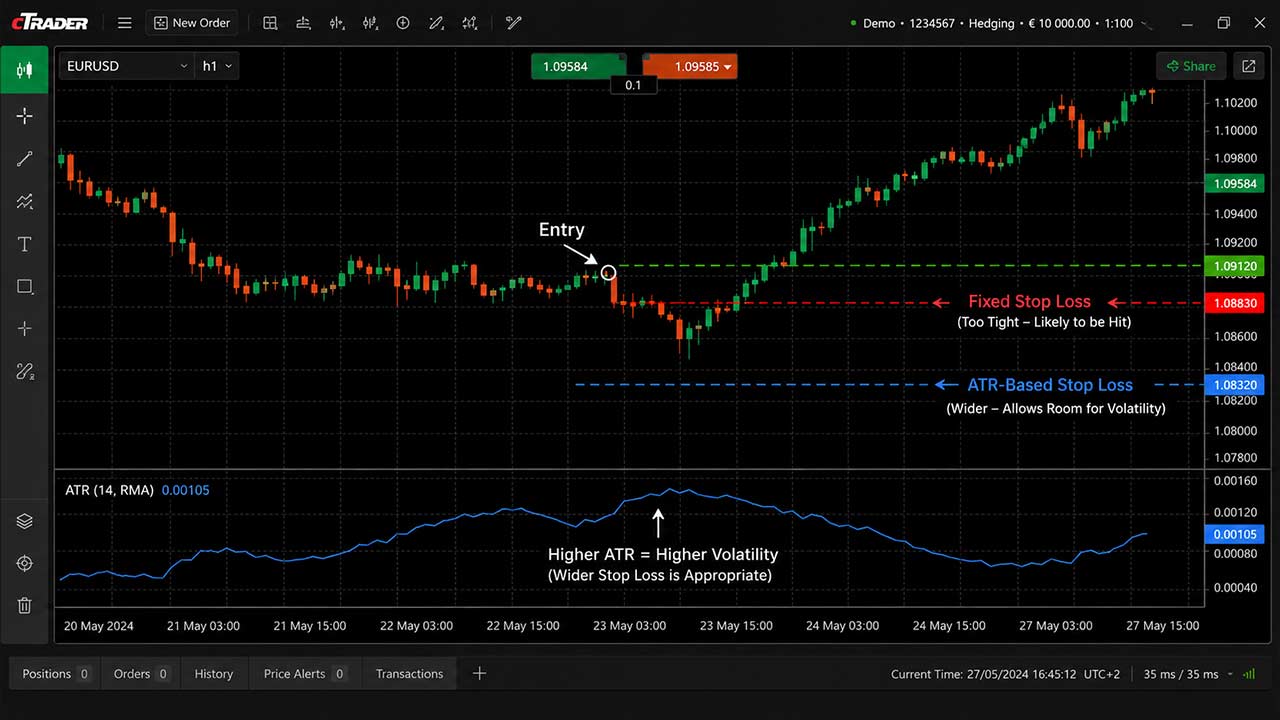
A 20-pip stop may be too wide during a quiet session. The same 20-pip stop may be too tight during a volatile session. If you want a deeper breakdown, we also explain how to use the ATR indicator for stop-loss placement with a more direct focus on stop positioning.
Average True Range in trading gives you a better way.
Instead of using a fixed stop, you can place your stop based on current volatility. A common method is using a multiple of Average True Range.
For example:
If Average True Range is 10 points and you use a 1.5x Average True Range stop, your stop would be 15 points away.
If Average True Range is 20 points and you use the same 1.5x Average True Range stop, your stop would be 30 points away.
This adjusts your stop to the market. When volatility is low, the stop becomes tighter. When volatility is high, the stop becomes wider.
That does not mean a wider stop is always better. It means the stop is based on the current market environment instead of a random number.
A good Average True Range stop gives the trade enough space to breathe without placing risk too far away.
Using ATR in Trading for Take-Profit Targets
Average True Range in trading can also help with targets.
If the Average True Range shows that a market usually moves 50 pips per day, setting a 150-pip target for a day trade may not make sense unless there is a major catalyst. It can happen, but it is not normal.
Average True Range helps you set targets that match the market’s average movement. This works well when combined with a proper plan for SL and TP, because both sides of the trade need to make sense before you enter.
For example, if a forex pair has a daily Average True Range of 70 pips, and price has already moved 65 pips today, entering late and aiming for another 70 pips may be risky. The market may already be stretched for the day.
This does not mean price cannot continue. It means you should be more careful.
Average True Range in trading helps you avoid chasing moves after most of the daily range has already happened.
Using ATR for Position Size
Average True Range in trading can also guide position size.
When volatility is high, stops often need to be wider. If you keep the same lot size with a wider stop, you risk more money than usual.
That is a common mistake.
For example, say you normally risk $100 per trade. If your stop is 20 pips, your position size will be different than if your stop is 50 pips. The wider stop needs a smaller position size to keep the same dollar risk.
Average True Range helps you adjust. This is especially important for funded traders, where risk management matters more than chasing one big trade.
When Average True Range rises, you may need to reduce trade size. When Average True Range falls, you may be able to use a normal size with a tighter stop.
The point is not to trade bigger just because the market is quiet. The point is to keep risk consistent.
Many traders lose control during volatile markets because they use the same position size they use during normal conditions. Average True Range in trading can help prevent that.
ATR in Trading and Breakout Strategies
Average True Range in trading is useful for breakout traders because breakouts need movement.
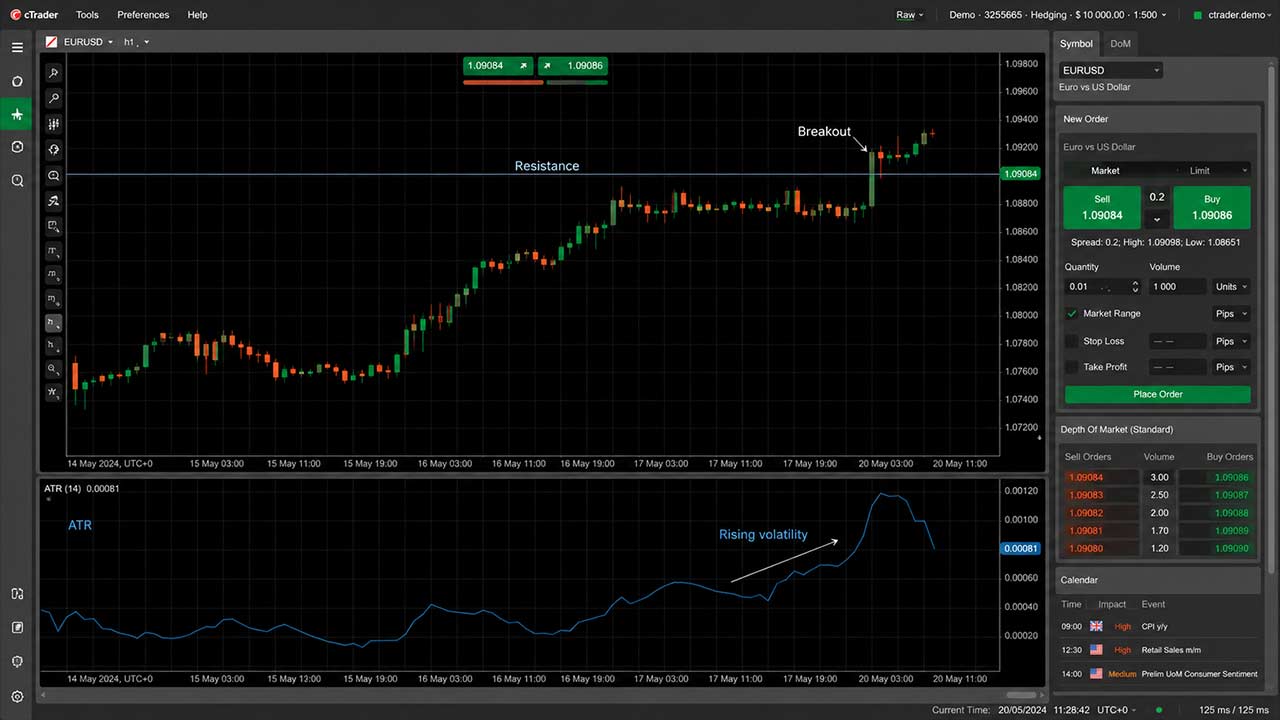
A breakout during low volatility can be tricky. Price may move above resistance or below support, then quickly come back into the range. This is often called a false breakout.
When Average True Range starts rising during a breakout, it can suggest that movement is expanding. That can support the breakout idea.
But Average True Range still does not confirm direction by itself.
You should not buy just because Average True Range rises. You should look at price structure, volume if available, support and resistance, and candle behavior.
Average True Range simply tells you whether volatility is expanding.
A strong breakout usually needs more than a small push. Average True Range in trading helps you see if the market has enough movement behind it.
Combining ATR With Trend Strategies
Average True Range in trading can also help trend traders.
In a strong trend, Average True Range may rise or stay above its recent average because candles are larger and price is covering more ground.
This can help traders avoid cutting winning trades too early.
One method is using an Average True Range-based trailing stop. Instead of moving the stop too close to current price, the trader trails it by a multiple of Average True Range.
For example, in an uptrend, a trader may trail the stop 2x Average True Range below the recent high. This gives the trade room to move while still protecting profit if price reverses.
A popular Average True Range-based exit method is the Chandelier Exit. It places a trailing stop a set Average True Range multiple away from the highest high after entry.
The goal is simple: stay in the trend while the move is still healthy, then exit when price pulls back more than normal volatility allows.
ATR and Range-Bound Markets
Average True Range in trading can also warn you when the market is too quiet.
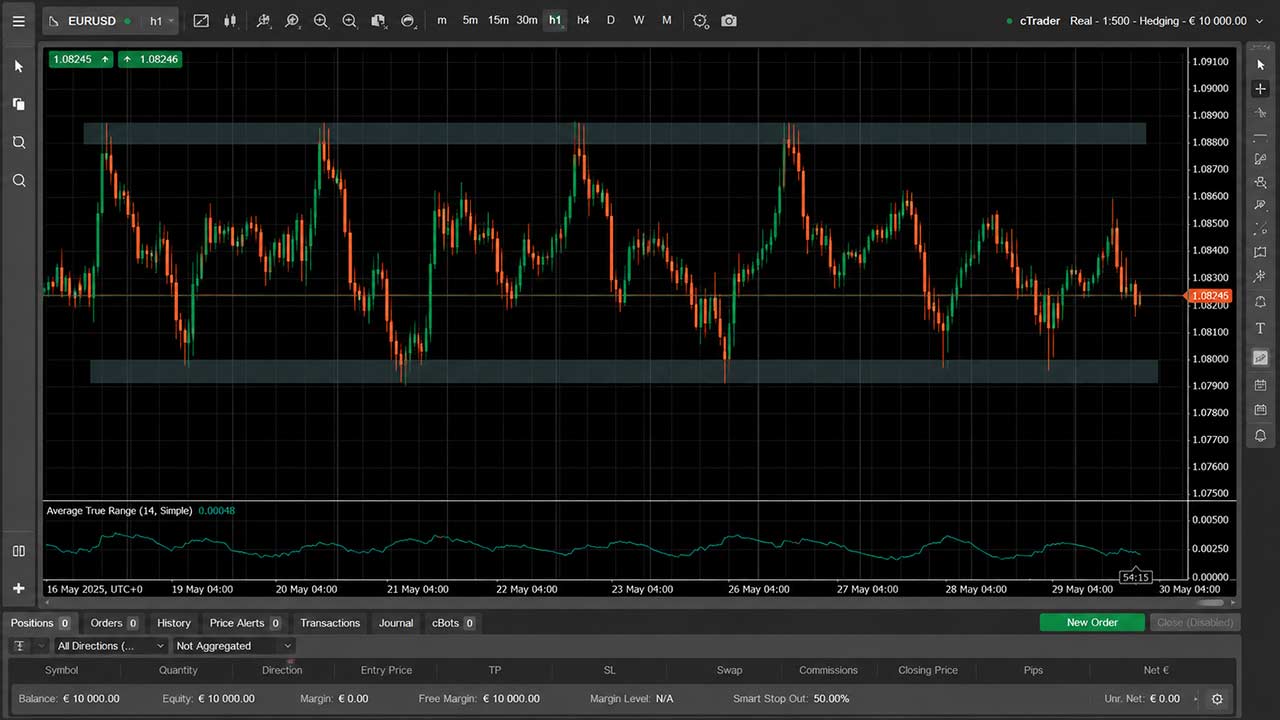
Low Average True Range often appears during sideways markets. Price may be stuck between support and resistance. Breakouts may fail. Targets may take longer to hit.
This does not mean you cannot trade. It means you need to adjust.
In low Average True Range conditions, a range trader may focus on smaller targets. A breakout trader may wait for volatility to expand first. A trend trader may stay patient until price shows stronger movement.
Low Average True Range can also come before a bigger move. Markets often move from quiet periods into active periods.
But you should not assume low Average True Range always means a breakout is coming. It only means movement is currently compressed.
Common ATR Mistakes While Trading
The biggest mistake is treating Average True Range in trading like a buy or sell signal.
Average True Range does not tell you where price will go. It only tells you how much price is moving.
Another mistake is using the same Average True Range rules across all markets. A 2x Average True Range stop on Gold is not the same as a 2x Average True Range stop on EUR/USD or a tech stock. Each market has its own behavior.
Traders also make the mistake of ignoring timeframe.
Average True Range on a daily chart tells you daily volatility. Average True Range on a 15-minute chart tells you short-term volatility. You should match the Average True Range timeframe to the trade you are taking.
If you are day trading, intraday Average True Range may be more useful. If you are swing trading, daily Average True Range may matter more.
Another mistake is using Average True Range without market structure. Average True Range can help you place a stop, but that stop should still make sense on the chart. It should not sit in a random place.
A better approach is to combine Average True Range in trading with support, resistance, trendlines, swing highs, swing lows, and price action.
How to Use ATR Before Entering a Trade
If you are learning how to use ATR in trading, start with a simple checklist before entering any position.
Before entering a trade, look at Average True Range and ask:
Is Average True Range high or low compared to recent readings?
If Average True Range is high, expect wider price swings and adjust position size.
If Average True Range is low, expect slower movement and avoid unrealistic targets.
Is the stop placed beyond normal market noise?
Is the target realistic based on current volatility?
Has price already moved most of its average range?
These checks take little time, but they can improve trade planning significantly.
A Simple ATR in Example Trade
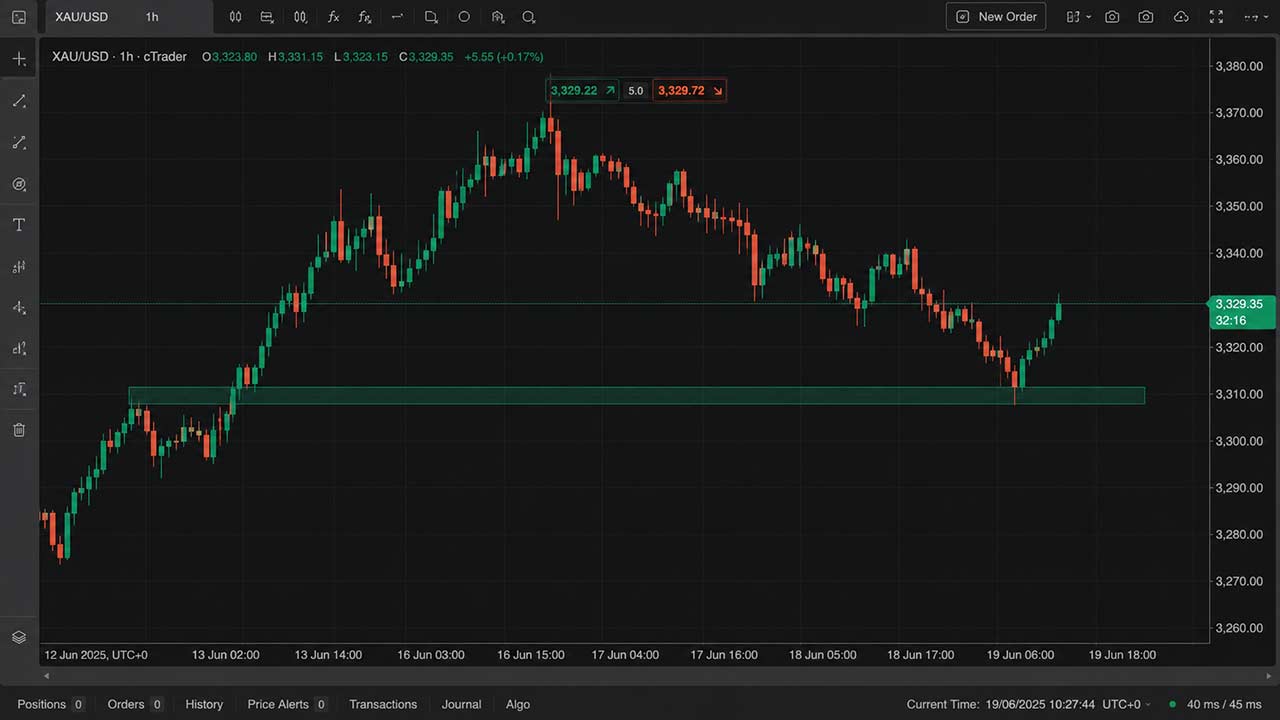
Let’s say you trade XAU/USD on the 1-hour chart.
You see a bullish setup near support. The Average True Range on the 1-hour chart is $4. That means Gold has been moving about $4 per candle on average over the selected period.
If you place your stop only $2 away, that stop may be too tight. Normal movement could knock you out even if your trade idea is still valid.
A 1.5x Average True Range stop would be $6 away. A 2x Average True Range stop would be $8 away.
You would still need to check the chart. Maybe support is $7 away. Maybe the swing low is $6.50 away. Average True Range in trading helps you judge whether that distance fits current volatility.
Then you adjust your lot size so your risk stays controlled.
This is how Average True Range helps. It does not make the decision for you. It gives you better information before you decide.
Final Thoughts
Average True Range in trading is one of the most useful tools because it answers a question many traders ignore:
How much is this market moving right now?
That answer affects everything.
It affects your stop-loss. It affects your target. It affects your position size. It affects whether a trade is worth taking at all.
Average True Range will not tell you if price will go up or down. It will not predict the next candle. It will not turn a weak setup into a strong one.
But it can help you stop trading with random stops, random targets, and random risk.
Before every trade, Average True Range in trading gives you a powerful edge by revealing exactly how the market is moving right now.
Smart traders rely on it alongside price action, support and resistance, trend structure, and disciplined risk control to trade with confidence and precision.
When using platforms like Pipstone Capital, traders can apply ATR seamlessly with advanced charting tools, fast execution, and tight spreads, making it easier to manage volatility and execute well-planned trades.
That is where Average True Range becomes useful.
Not as a signal.
As a reality check.
FAQ: ATR
What is the ATR full form in trading?
The ATR full form in trading is Average True Range. It is a volatility indicator that measures how much price moves over a specific period.
How to use ATR in trading effectively?
To understand how to use ATR in trading, focus on stop-loss placement, position sizing, and realistic target setting. Average True Range helps you align your trades with current market volatility.
Does ATR in trading predict price direction?
No, Average True Range in trading does not predict direction. It only measures volatility and shows how much price is moving.
What is a good ATR setting?
The most common setting is 14 periods, but traders may adjust it based on their strategy and timeframe.



ATR in Trading: What It Tells You Before Every Trade
Most traders look at price first. They check if the market is moving up, down, or sideways. Then they look for an entry.
That is normal. But it misses one key question.
How much is this market moving right now?
That is where Average True Range in trading becomes important.
ATR stands for Average True Range. If you are wondering about the ATR full form in trading, it simply refers to a volatility indicator that measures how much price moves over a specific period.
Average True Range does not tell you if price will go up or down. It does not give buy or sell signals on its own. Instead, Average True Range in trading tells you how active the market is. That single detail can change how you place stops, set targets, size your trades, and decide whether a setup is worth taking.
Before every trade, Average True Range helps you answer one simple question:
Is this market quiet, normal, or moving aggressively?
That answer matters more than many traders think.
What Is ATR in Trading?
Average True Range in trading is a volatility indicator created by J. Welles Wilder Jr. Traders use it to measure the average size of price movement over a set number of candles.
The most common Average True Range setting is 14 periods. On a daily chart, that means Average True Range looks at the past 14 daily candles. On a 1-hour chart, it looks at the past 14 hourly candles. On a 15-minute chart, it looks at the past 14 15-minute candles.
The idea is simple. Average True Range in trading looks at how much price has been moving and gives you an average reading.
For example, if Gold has an Average True Range of 20 on the daily chart, it means Gold has been moving around $20 per day on average over the selected period. If EUR/USD has an Average True Range of 0.0060 on the daily chart, it means the pair has been moving around 60 pips per day on average.
The exact value depends on the market and chart timeframe.
This is why Average True Range in trading should not be compared blindly across different assets. A stock trading at $500 will usually have a higher Average True Range than a stock trading at $20. Gold will show different Average True Range values than a forex pair. Bitcoin will show different Average True Range values than a major currency pair.
Average True Range works best when you compare the current reading against the same market’s past behavior.
What Average True Range Actually Tells You
Average True Range in trading tells you how much price is moving. That is it.
It does not tell you price direction. A rising Average True Range does not mean the market is bullish. A falling Average True Range does not mean the market is bearish.
Average True Range can rise during a strong rally. It can also rise during a sharp selloff. It only tells you that movement is getting larger.
This is why Average True Range in trading is useful before entering a trade. It gives context.
A setup during low Average True Range is not the same as a setup during high Average True Range. A breakout during a quiet market may need different stop placement than a breakout during a high-volatility session. A fixed 20-pip stop might make sense in one market condition and be too tight in another.
Average True Range helps you stop guessing.
How ATR Is Calculated
You do not need to calculate Average True Range in trading by hand because most trading platforms do it for you. But it helps to understand what is behind it.
Average True Range starts with True Range.
True Range is the largest of these three values:
Current high minus current low
Current high minus the previous close
Current low minus the previous close
The second and third options use absolute values, so negative numbers are ignored. The goal is to measure movement, not direction.
This matters because markets do not always move smoothly from one candle to the next. Sometimes there are gaps. Sometimes price opens far above or below the previous close. True Range accounts for that.
After True Range is calculated, Average True Range averages those values over the chosen period.
The default setting is often 14 periods. Some traders use shorter settings like 5 or 10 to focus on recent movement. Others use longer settings like 20 or 50 to smooth the reading.
A shorter Average True Range reacts faster. A longer Average True Range is smoother but slower.
Neither is “best” for every trader. It depends on your trading style.
Why ATR Matters Before Every Trade
Many traders enter trades based only on direction. They see a bullish setup and buy. They see a bearish setup and sell.
The problem is that direction is only part of the trade.
You also need to know whether the market is moving enough to make the trade worth it. You need to know where your stop has enough room. You need to know if your target is realistic.
Average True Range in trading helps with all of that.
Before taking a trade, Average True Range can help you answer:
Can price realistically reach my target?
Is my stop too close?
Is the market too quiet?
Is volatility too high for my normal risk?
Should I reduce my position size?
Should I skip the trade?
These questions keep traders out of weak setups and help them manage stronger ones with more care.
How to Use ATR for Stop-Loss Placement
One of the most practical ways to understand how to use ATR in trading is through stop-loss placement.
Many traders place stops based on random numbers. For example, they always use a 20-pip stop or a $10 stop. That may sound simple, but markets do not move the same way every day.
A 20-pip stop may be too wide during a quiet session. The same 20-pip stop may be too tight during a volatile session. If you want a deeper breakdown, we also explain how to use the ATR indicator for stop-loss placement with a more direct focus on stop positioning.
Average True Range in trading gives you a better way.
Instead of using a fixed stop, you can place your stop based on current volatility. A common method is using a multiple of Average True Range.
For example:
If Average True Range is 10 points and you use a 1.5x Average True Range stop, your stop would be 15 points away.
If Average True Range is 20 points and you use the same 1.5x Average True Range stop, your stop would be 30 points away.
This adjusts your stop to the market. When volatility is low, the stop becomes tighter. When volatility is high, the stop becomes wider.
That does not mean a wider stop is always better. It means the stop is based on the current market environment instead of a random number.
A good Average True Range stop gives the trade enough space to breathe without placing risk too far away.
Using ATR in Trading for Take-Profit Targets
Average True Range in trading can also help with targets.
If the Average True Range shows that a market usually moves 50 pips per day, setting a 150-pip target for a day trade may not make sense unless there is a major catalyst. It can happen, but it is not normal.
Average True Range helps you set targets that match the market’s average movement. This works well when combined with a proper plan for SL and TP, because both sides of the trade need to make sense before you enter.
For example, if a forex pair has a daily Average True Range of 70 pips, and price has already moved 65 pips today, entering late and aiming for another 70 pips may be risky. The market may already be stretched for the day.
This does not mean price cannot continue. It means you should be more careful.
Average True Range in trading helps you avoid chasing moves after most of the daily range has already happened.
Using ATR for Position Size
Average True Range in trading can also guide position size.
When volatility is high, stops often need to be wider. If you keep the same lot size with a wider stop, you risk more money than usual.
That is a common mistake.
For example, say you normally risk $100 per trade. If your stop is 20 pips, your position size will be different than if your stop is 50 pips. The wider stop needs a smaller position size to keep the same dollar risk.
Average True Range helps you adjust. This is especially important for funded traders, where risk management matters more than chasing one big trade.
When Average True Range rises, you may need to reduce trade size. When Average True Range falls, you may be able to use a normal size with a tighter stop.
The point is not to trade bigger just because the market is quiet. The point is to keep risk consistent.
Many traders lose control during volatile markets because they use the same position size they use during normal conditions. Average True Range in trading can help prevent that.
ATR in Trading and Breakout Strategies
Average True Range in trading is useful for breakout traders because breakouts need movement.
A breakout during low volatility can be tricky. Price may move above resistance or below support, then quickly come back into the range. This is often called a false breakout.
When Average True Range starts rising during a breakout, it can suggest that movement is expanding. That can support the breakout idea.
But Average True Range still does not confirm direction by itself.
You should not buy just because Average True Range rises. You should look at price structure, volume if available, support and resistance, and candle behavior.
Average True Range simply tells you whether volatility is expanding.
A strong breakout usually needs more than a small push. Average True Range in trading helps you see if the market has enough movement behind it.
Combining ATR With Trend Strategies
Average True Range in trading can also help trend traders.
In a strong trend, Average True Range may rise or stay above its recent average because candles are larger and price is covering more ground.
This can help traders avoid cutting winning trades too early.
One method is using an Average True Range-based trailing stop. Instead of moving the stop too close to current price, the trader trails it by a multiple of Average True Range.
For example, in an uptrend, a trader may trail the stop 2x Average True Range below the recent high. This gives the trade room to move while still protecting profit if price reverses.
A popular Average True Range-based exit method is the Chandelier Exit. It places a trailing stop a set Average True Range multiple away from the highest high after entry.
The goal is simple: stay in the trend while the move is still healthy, then exit when price pulls back more than normal volatility allows.
ATR and Range-Bound Markets
Average True Range in trading can also warn you when the market is too quiet.
Low Average True Range often appears during sideways markets. Price may be stuck between support and resistance. Breakouts may fail. Targets may take longer to hit.
This does not mean you cannot trade. It means you need to adjust.
In low Average True Range conditions, a range trader may focus on smaller targets. A breakout trader may wait for volatility to expand first. A trend trader may stay patient until price shows stronger movement.
Low Average True Range can also come before a bigger move. Markets often move from quiet periods into active periods.
But you should not assume low Average True Range always means a breakout is coming. It only means movement is currently compressed.
Common ATR Mistakes While Trading
The biggest mistake is treating Average True Range in trading like a buy or sell signal.
Average True Range does not tell you where price will go. It only tells you how much price is moving.
Another mistake is using the same Average True Range rules across all markets. A 2x Average True Range stop on Gold is not the same as a 2x Average True Range stop on EUR/USD or a tech stock. Each market has its own behavior.
Traders also make the mistake of ignoring timeframe.
Average True Range on a daily chart tells you daily volatility. Average True Range on a 15-minute chart tells you short-term volatility. You should match the Average True Range timeframe to the trade you are taking.
If you are day trading, intraday Average True Range may be more useful. If you are swing trading, daily Average True Range may matter more.
Another mistake is using Average True Range without market structure. Average True Range can help you place a stop, but that stop should still make sense on the chart. It should not sit in a random place.
A better approach is to combine Average True Range in trading with support, resistance, trendlines, swing highs, swing lows, and price action.
How to Use ATR Before Entering a Trade
If you are learning how to use ATR in trading, start with a simple checklist before entering any position.
Before entering a trade, look at Average True Range and ask:
Is Average True Range high or low compared to recent readings?
If Average True Range is high, expect wider price swings and adjust position size.
If Average True Range is low, expect slower movement and avoid unrealistic targets.
Is the stop placed beyond normal market noise?
Is the target realistic based on current volatility?
Has price already moved most of its average range?
These checks take little time, but they can improve trade planning significantly.
A Simple ATR in Example Trade
Let’s say you trade XAU/USD on the 1-hour chart.
You see a bullish setup near support. The Average True Range on the 1-hour chart is $4. That means Gold has been moving about $4 per candle on average over the selected period.
If you place your stop only $2 away, that stop may be too tight. Normal movement could knock you out even if your trade idea is still valid.
A 1.5x Average True Range stop would be $6 away. A 2x Average True Range stop would be $8 away.
You would still need to check the chart. Maybe support is $7 away. Maybe the swing low is $6.50 away. Average True Range in trading helps you judge whether that distance fits current volatility.
Then you adjust your lot size so your risk stays controlled.
This is how Average True Range helps. It does not make the decision for you. It gives you better information before you decide.
Final Thoughts
Average True Range in trading is one of the most useful tools because it answers a question many traders ignore:
How much is this market moving right now?
That answer affects everything.
It affects your stop-loss. It affects your target. It affects your position size. It affects whether a trade is worth taking at all.
Average True Range will not tell you if price will go up or down. It will not predict the next candle. It will not turn a weak setup into a strong one.
But it can help you stop trading with random stops, random targets, and random risk.
Before every trade, Average True Range in trading gives you a powerful edge by revealing exactly how the market is moving right now.
Smart traders rely on it alongside price action, support and resistance, trend structure, and disciplined risk control to trade with confidence and precision.
When using platforms like Pipstone Capital, traders can apply ATR seamlessly with advanced charting tools, fast execution, and tight spreads, making it easier to manage volatility and execute well-planned trades.
That is where Average True Range becomes useful.
Not as a signal.
As a reality check.
FAQ: ATR
What is the ATR full form in trading?
The ATR full form in trading is Average True Range. It is a volatility indicator that measures how much price moves over a specific period.
How to use ATR in trading effectively?
To understand how to use ATR in trading, focus on stop-loss placement, position sizing, and realistic target setting. Average True Range helps you align your trades with current market volatility.
Does ATR in trading predict price direction?
No, Average True Range in trading does not predict direction. It only measures volatility and shows how much price is moving.
What is a good ATR setting?
The most common setting is 14 periods, but traders may adjust it based on their strategy and timeframe.
