How to Use the Volume Indicator to Improve Trade Decisions

Most traders focus only on price. They watch charts, patterns, and indicators, then enter trades based on direction. But price alone does not tell the full story. You also need to know how strong that move is.
This is where the volume indicator helps.
Volume shows how active the market is. It tells you if traders are backing a move or ignoring it. When you understand this, your decisions become clearer and more confident.
Let’s break it down in simple terms and show how to actually use volume in real trades.
What the Volume Indicator Shows
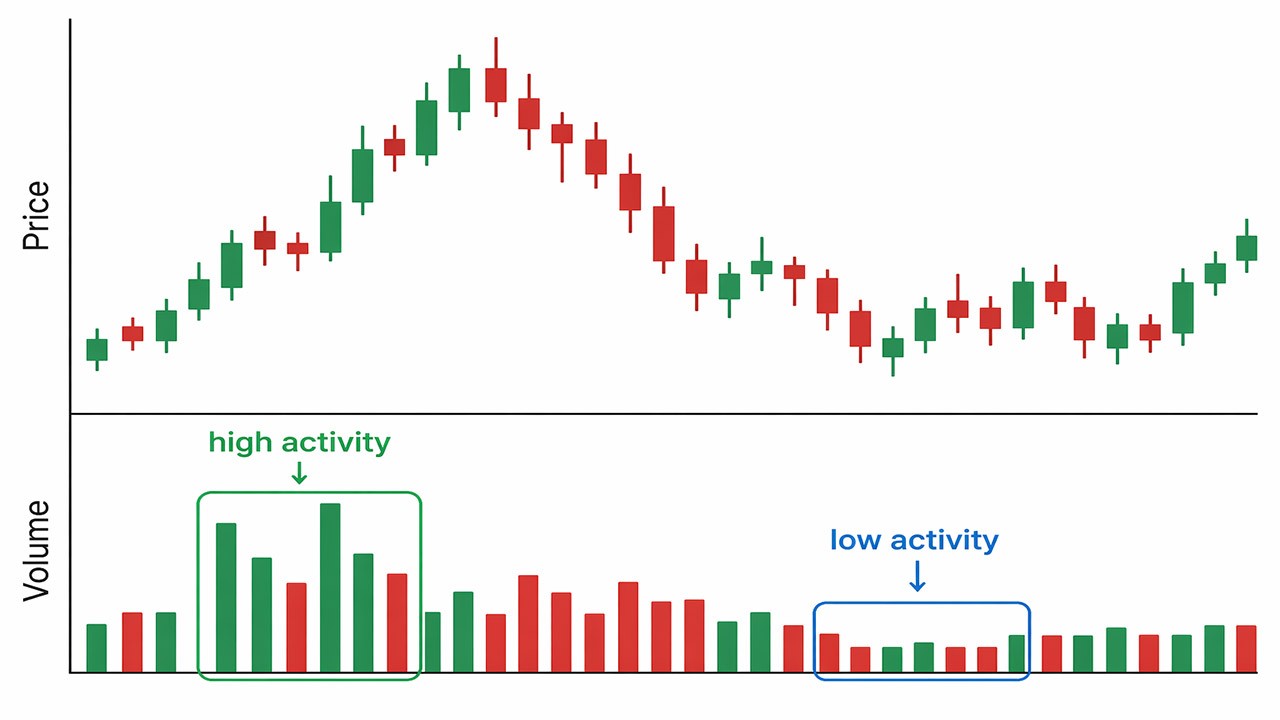
The volume indicator measures market activity over a period. It usually appears as bars below your chart.
Each bar shows how much trading happened during that time.
Tall bars mean high activity
Small bars mean low activity
In forex, this is based on tick volume, not real traded volume. That means it counts price changes, not exact trade size. Still, it gives a strong idea of market interest.
Think of volume like energy behind a move. Price shows direction. Volume shows strength.
Why Volume Matters in Trading?
A price move without volume is weak. It may not last.
A price move with strong volume is more reliable. It shows traders agree with the direction.
This helps you answer key questions:
Is this trend strong or weak?
Is this breakout real or fake?
Are buyers or sellers in control?
Without volume, you are guessing. With volume, you have context.

Volume Confirms Trends
One of the most basic uses of volume is trend confirmation.
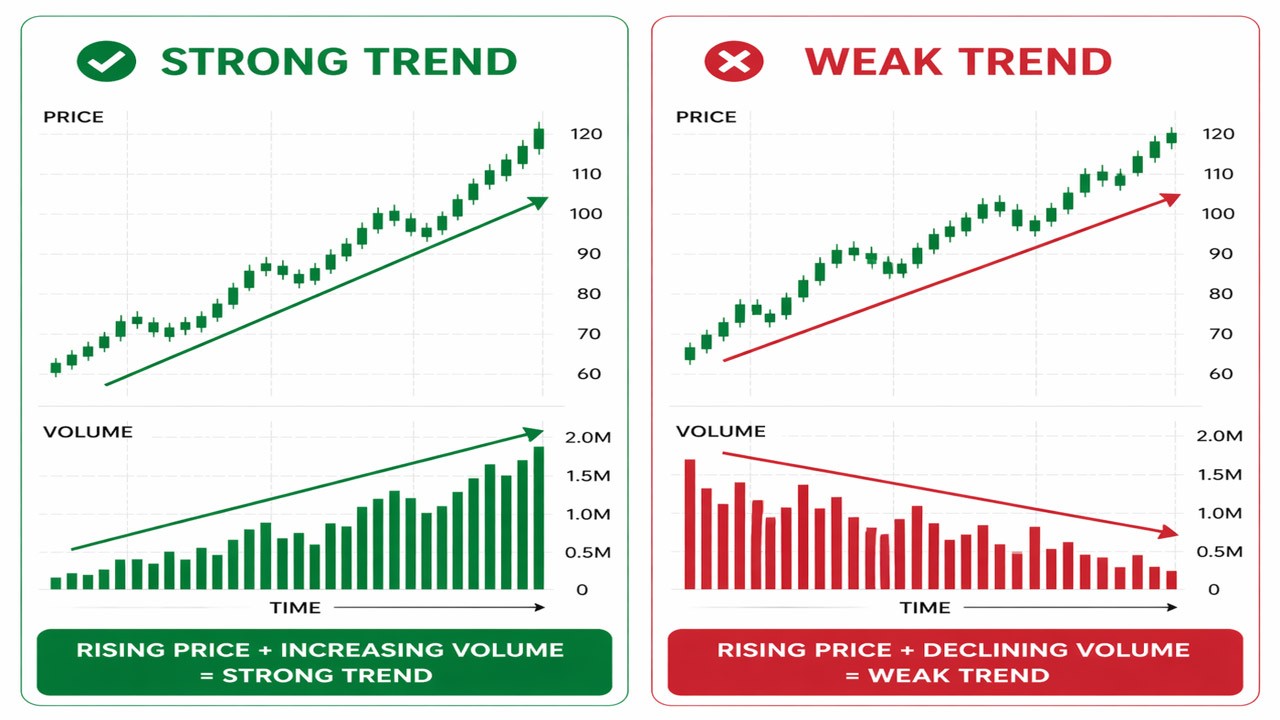
Strong Trend
When price moves in one direction and volume increases, the trend is strong.
Example:
Price is rising
Volume is also rising
This means buyers are active and pushing price higher. The move has support.
Weak Trend
When price moves but volume drops, the trend is weak.
Example:
Price is rising
Volume is falling
This shows fewer traders are backing the move. It may slow down or reverse.
What This Means for You
You should feel more confident trading in the direction of a trend when volume supports it. If volume does not match, be careful.
To build a more structured approach around this, read this guide on Forex Trading Tips.
Volume Indicator Helps Spot Reversals
Trends do not last forever. Volume can warn you when a change is coming.
Fading Volume
If a trend continues but volume keeps dropping, momentum is fading.
Example:
Price keeps rising
Volume slowly declines
This often means buyers are losing strength. A reversal may be near.
Sudden Volume Spike
A sharp increase in volume after a long trend can signal a turning point.
This can happen when:
Big traders close positions
New traders enter in the opposite direction
What to Watch
When volume and price stop moving together, pay attention. That mismatch is often a clue.
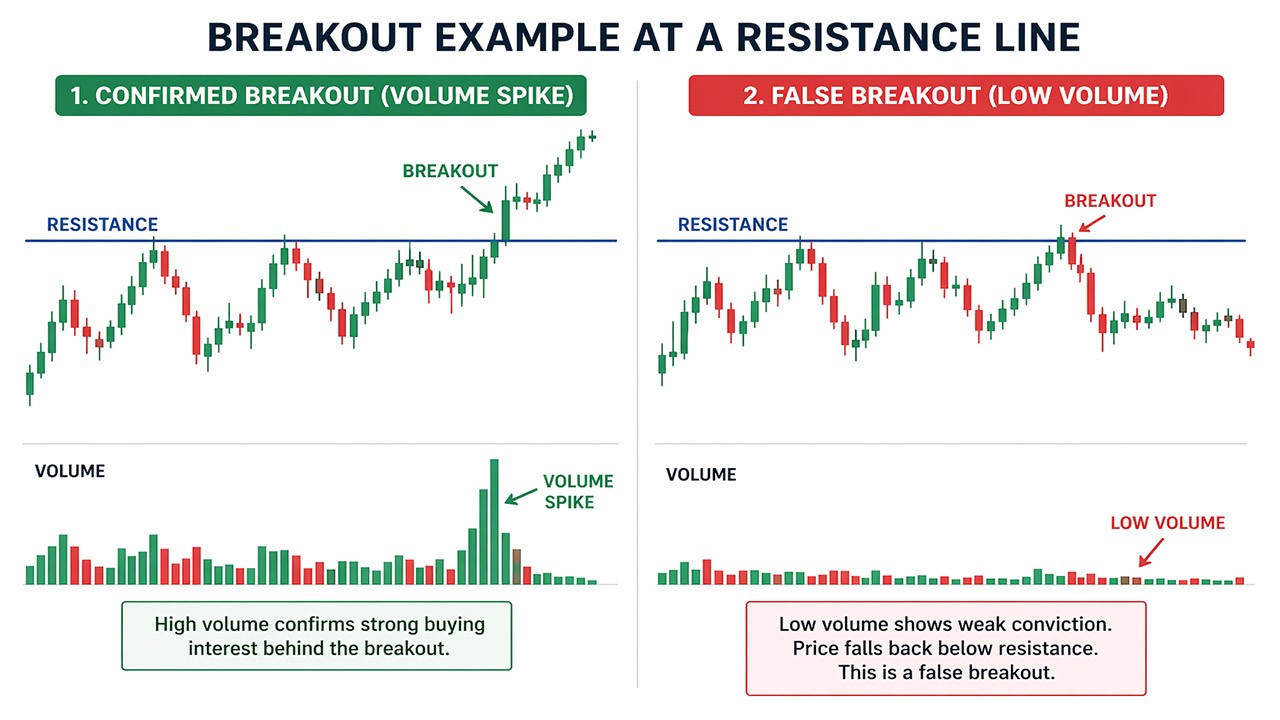
Volume Confirms Breakouts
Breakouts are popular trading setups. Price moves above resistance or below support.
But many breakouts fail. Volume helps you filter them.
Strong Breakout
Price breaks a key level
Volume increases sharply
This shows strong participation. The breakout is more likely to continue.
Weak Breakout
Price breaks a level
Volume stays low
This move may not hold. It could be a false breakout.
Practical Tip
Wait for volume to confirm the breakout before entering. This reduces bad trades.
Volume confirms entries, but exits matter just as much. Learn how to manage both in Stop Loss (SL) and Take Profit (TP).
Understanding Buying and Selling Pressure
Volume also shows who is in control.
Buyers in Control
Price rises
Volume increases
This shows strong demand. Buyers are pushing price higher.
Sellers in Control
Price falls
Volume increases
This shows strong supply. Sellers dominate the market.
Low Volume Moves
When price moves with low volume, neither side is strong. The market is unsure.
This often leads to:
Sideways movement
Choppy conditions
In these cases, it is better to wait.
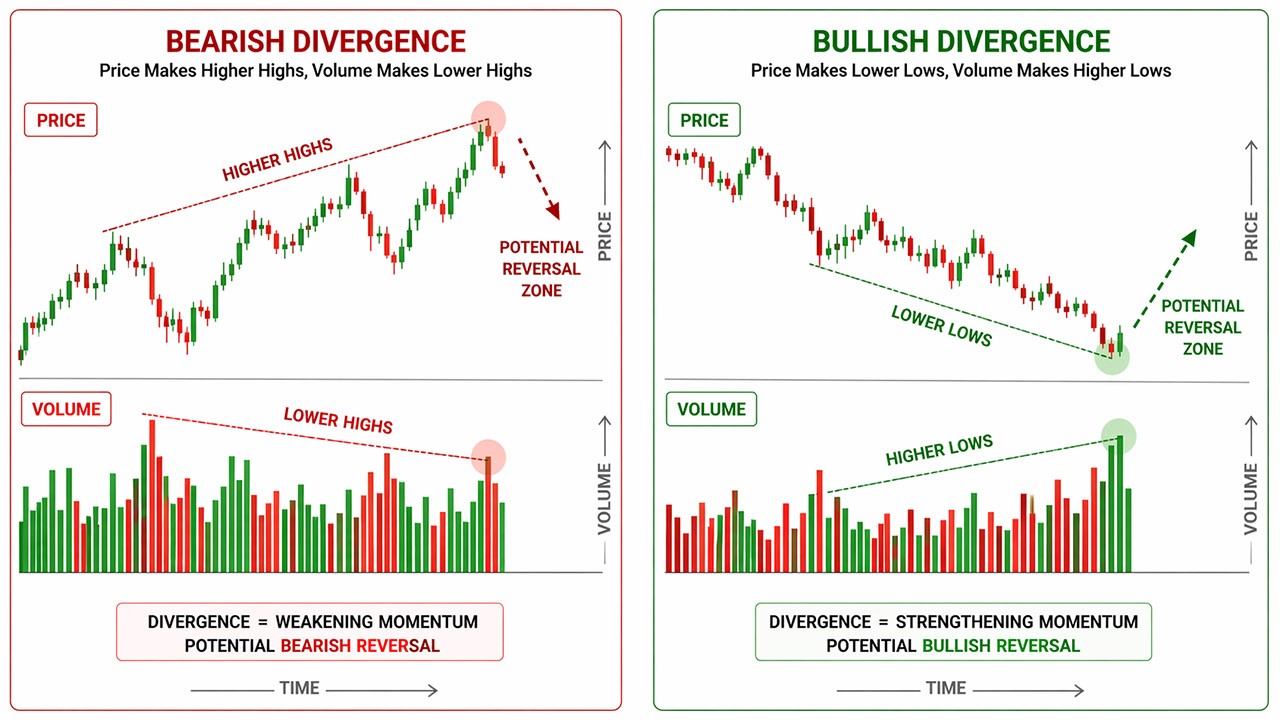
The Power of Volume Divergence
One of the most useful volume signals is divergence.
This happens when price and volume move in opposite ways.
Bearish Divergence
Price keeps rising
Volume decreases
This means buyers are losing strength. The move may reverse downward.
Bullish Divergence
Price keeps falling
Volume increases
This shows sellers may be exhausted. A reversal upward is possible.
Why It Works
Volume shows what traders are doing behind the scenes. When price moves but volume disagrees, something is off.
This gives you an early warning.
Popular Volume-Based Indicators
Many indicators use volume data to give clearer signals.
On-Balance Volume (OBV)
OBV tracks buying and selling pressure over time.
Adds volume when price closes higher
Subtracts volume when price closes lower
It helps confirm trends and spot divergence.
Accumulation/Distribution (A/D)
This indicator shows if traders are buying or selling overall.
It helps you see if a move has hidden strength.
Volume Price Trend (VPT)
VPT combines price and volume into one line.
It shows if volume supports the price move.
Keep It Simple
You do not need all of them. Even basic volume bars can give strong insight.
How to Use Volume in Real Trades
Now let’s bring everything together.
1. Combine Volume with Support and Resistance
Key levels matter more when volume is involved.
Example:
Price reaches resistance
Volume spikes
This may lead to a strong rejection or breakout.
If volume is low, the level may not hold.
2. Use Volume with Trend Indicators
Volume works well with moving averages like EMA.
Example:
Price above EMA
Volume rising
This confirms a strong trend.
If price is above EMA but volume drops, the trend may weaken.
3. Pair Volume with Momentum Tools
You can combine volume with RSI or MACD.
Example:
RSI shows overbought
Volume drops
This strengthens the case for a pullback.
Volume helps confirm what other indicators suggest.
4. Wait for Volume Before Entering Trades
Many traders rush into trades based on price alone.
A better approach:
Wait for the setup
Check volume
Enter only if volume supports the move
This adds an extra layer of confirmation.
Strong confirmation still needs proper risk control and position sizing. This breakdown of Margin vs Leverage.
Common Mistakes to Avoid
Using Volume Alone
Volume is not a full strategy. It works best with other tools.
Always combine it with:
Price action
Key levels
Trend direction
Ignoring Market Context
Volume signals mean more at key areas.
A volume spike in the middle of nowhere is less useful than one at support or resistance.
Overcomplicating It
You do not need many volume indicators.
Start with basic volume bars. Learn how they behave. Then add tools if needed.
Misreading Low Volume
Low volume does not always mean a reversal.
Sometimes the market is just quiet. Look at the bigger picture.
Simple Volume Rules to Follow
Keep these in mind during trading:
Strong moves need strong volume
Weak volume means weak conviction
Volume should match the trend
Divergence is a warning sign
Breakouts need volume to hold
If these rules are clear, your decisions become easier.
A Simple Trade Example
Let’s walk through a basic setup.
Price approaches resistance
You wait for a breakout
Price breaks above the level
Volume increases sharply
This confirms the breakout. You enter the trade.
Now compare this:
Price breaks resistance
Volume stays low
This is risky. The move may fail. You avoid the trade.
Same setup, different outcome. Volume makes the difference.
Final Thoughts
The volume indicator is simple but powerful. It adds context to price and helps you avoid weak setups.
It does not predict the future. It shows what traders are doing right now. That alone can improve your timing and confidence.
Focus on how volume behaves around key levels and trends. Watch for confirmation, not just signals.
When you combine volume with structure and trend, your decisions become more clear and less emotional.
Keep it simple. Read the chart. Let volume guide you, not control you.
If you want to apply these concepts in real trading conditions, joining Pipstone Capital can help you practice with real rules, real execution, and a clear path to scaling your account. It gives you a structured environment where using tools like volume actually matters for passing and growing.
FAQs
What is the volume indicator in forex?
The volume indicator shows how active the market is. In forex, it uses tick volume, which counts price changes instead of real trade size.
Can you trade using volume alone?
No. Volume works best as a confirmation tool. You should always combine it with price action, trend, and key levels.
What does high volume mean in trading?
High volume means strong interest from traders. It usually supports the current price move and makes it more reliable.
What does low volume mean?
Low volume shows weak interest. Moves with low volume often fail or lead to sideways markets.
How do you use volume for breakouts?
Look for a volume spike when price breaks a key level. If volume is low, the breakout may be false.
What is volume divergence?
Volume divergence happens when price and volume move in opposite directions. It often signals a possible reversal.
Is volume useful for beginners?
Yes. Volume is simple to read and adds clarity to price action. Even basic volume bars can improve trade decisions.


How to Use the Volume Indicator to Improve Trade Decisions
Most traders focus only on price. They watch charts, patterns, and indicators, then enter trades based on direction. But price alone does not tell the full story. You also need to know how strong that move is.
This is where the volume indicator helps.
Volume shows how active the market is. It tells you if traders are backing a move or ignoring it. When you understand this, your decisions become clearer and more confident.
Let’s break it down in simple terms and show how to actually use volume in real trades.
What the Volume Indicator Shows
The volume indicator measures market activity over a period. It usually appears as bars below your chart.
Each bar shows how much trading happened during that time.
Tall bars mean high activity
Small bars mean low activity
In forex, this is based on tick volume, not real traded volume. That means it counts price changes, not exact trade size. Still, it gives a strong idea of market interest.
Think of volume like energy behind a move. Price shows direction. Volume shows strength.
Why Volume Matters in Trading?
A price move without volume is weak. It may not last.
A price move with strong volume is more reliable. It shows traders agree with the direction.
This helps you answer key questions:
Is this trend strong or weak?
Is this breakout real or fake?
Are buyers or sellers in control?
Without volume, you are guessing. With volume, you have context.
Volume Confirms Trends
One of the most basic uses of volume is trend confirmation.
Strong Trend
When price moves in one direction and volume increases, the trend is strong.
Example:
Price is rising
Volume is also rising
This means buyers are active and pushing price higher. The move has support.
Weak Trend
When price moves but volume drops, the trend is weak.
Example:
Price is rising
Volume is falling
This shows fewer traders are backing the move. It may slow down or reverse.
What This Means for You
You should feel more confident trading in the direction of a trend when volume supports it. If volume does not match, be careful.
To build a more structured approach around this, read this guide on Forex Trading Tips.
Volume Indicator Helps Spot Reversals
Trends do not last forever. Volume can warn you when a change is coming.
Fading Volume
If a trend continues but volume keeps dropping, momentum is fading.
Example:
Price keeps rising
Volume slowly declines
This often means buyers are losing strength. A reversal may be near.
Sudden Volume Spike
A sharp increase in volume after a long trend can signal a turning point.
This can happen when:
Big traders close positions
New traders enter in the opposite direction
What to Watch
When volume and price stop moving together, pay attention. That mismatch is often a clue.
Volume Confirms Breakouts
Breakouts are popular trading setups. Price moves above resistance or below support.
But many breakouts fail. Volume helps you filter them.
Strong Breakout
Price breaks a key level
Volume increases sharply
This shows strong participation. The breakout is more likely to continue.
Weak Breakout
Price breaks a level
Volume stays low
This move may not hold. It could be a false breakout.
Practical Tip
Wait for volume to confirm the breakout before entering. This reduces bad trades.
Volume confirms entries, but exits matter just as much. Learn how to manage both in Stop Loss (SL) and Take Profit (TP).
Understanding Buying and Selling Pressure
Volume also shows who is in control.
Buyers in Control
Price rises
Volume increases
This shows strong demand. Buyers are pushing price higher.
Sellers in Control
Price falls
Volume increases
This shows strong supply. Sellers dominate the market.
Low Volume Moves
When price moves with low volume, neither side is strong. The market is unsure.
This often leads to:
Sideways movement
Choppy conditions
In these cases, it is better to wait.
The Power of Volume Divergence
One of the most useful volume signals is divergence.
This happens when price and volume move in opposite ways.
Bearish Divergence
Price keeps rising
Volume decreases
This means buyers are losing strength. The move may reverse downward.
Bullish Divergence
Price keeps falling
Volume increases
This shows sellers may be exhausted. A reversal upward is possible.
Why It Works
Volume shows what traders are doing behind the scenes. When price moves but volume disagrees, something is off.
This gives you an early warning.
Popular Volume-Based Indicators
Many indicators use volume data to give clearer signals.
On-Balance Volume (OBV)
OBV tracks buying and selling pressure over time.
Adds volume when price closes higher
Subtracts volume when price closes lower
It helps confirm trends and spot divergence.
Accumulation/Distribution (A/D)
This indicator shows if traders are buying or selling overall.
It helps you see if a move has hidden strength.
Volume Price Trend (VPT)
VPT combines price and volume into one line.
It shows if volume supports the price move.
Keep It Simple
You do not need all of them. Even basic volume bars can give strong insight.
How to Use Volume in Real Trades
Now let’s bring everything together.
1. Combine Volume with Support and Resistance
Key levels matter more when volume is involved.
Example:
Price reaches resistance
Volume spikes
This may lead to a strong rejection or breakout.
If volume is low, the level may not hold.
2. Use Volume with Trend Indicators
Volume works well with moving averages like EMA.
Example:
Price above EMA
Volume rising
This confirms a strong trend.
If price is above EMA but volume drops, the trend may weaken.
3. Pair Volume with Momentum Tools
You can combine volume with RSI or MACD.
Example:
RSI shows overbought
Volume drops
This strengthens the case for a pullback.
Volume helps confirm what other indicators suggest.
4. Wait for Volume Before Entering Trades
Many traders rush into trades based on price alone.
A better approach:
Wait for the setup
Check volume
Enter only if volume supports the move
This adds an extra layer of confirmation.
Strong confirmation still needs proper risk control and position sizing. This breakdown of Margin vs Leverage.
Common Mistakes to Avoid
Using Volume Alone
Volume is not a full strategy. It works best with other tools.
Always combine it with:
Price action
Key levels
Trend direction
Ignoring Market Context
Volume signals mean more at key areas.
A volume spike in the middle of nowhere is less useful than one at support or resistance.
Overcomplicating It
You do not need many volume indicators.
Start with basic volume bars. Learn how they behave. Then add tools if needed.
Misreading Low Volume
Low volume does not always mean a reversal.
Sometimes the market is just quiet. Look at the bigger picture.
Simple Volume Rules to Follow
Keep these in mind during trading:
Strong moves need strong volume
Weak volume means weak conviction
Volume should match the trend
Divergence is a warning sign
Breakouts need volume to hold
If these rules are clear, your decisions become easier.
A Simple Trade Example
Let’s walk through a basic setup.
Price approaches resistance
You wait for a breakout
Price breaks above the level
Volume increases sharply
This confirms the breakout. You enter the trade.
Now compare this:
Price breaks resistance
Volume stays low
This is risky. The move may fail. You avoid the trade.
Same setup, different outcome. Volume makes the difference.
Final Thoughts
The volume indicator is simple but powerful. It adds context to price and helps you avoid weak setups.
It does not predict the future. It shows what traders are doing right now. That alone can improve your timing and confidence.
Focus on how volume behaves around key levels and trends. Watch for confirmation, not just signals.
When you combine volume with structure and trend, your decisions become more clear and less emotional.
Keep it simple. Read the chart. Let volume guide you, not control you.
If you want to apply these concepts in real trading conditions, joining Pipstone Capital can help you practice with real rules, real execution, and a clear path to scaling your account. It gives you a structured environment where using tools like volume actually matters for passing and growing.
FAQs
What is the volume indicator in forex?
The volume indicator shows how active the market is. In forex, it uses tick volume, which counts price changes instead of real trade size.
Can you trade using volume alone?
No. Volume works best as a confirmation tool. You should always combine it with price action, trend, and key levels.
What does high volume mean in trading?
High volume means strong interest from traders. It usually supports the current price move and makes it more reliable.
What does low volume mean?
Low volume shows weak interest. Moves with low volume often fail or lead to sideways markets.
How do you use volume for breakouts?
Look for a volume spike when price breaks a key level. If volume is low, the breakout may be false.
What is volume divergence?
Volume divergence happens when price and volume move in opposite directions. It often signals a possible reversal.
Is volume useful for beginners?
Yes. Volume is simple to read and adds clarity to price action. Even basic volume bars can improve trade decisions.
